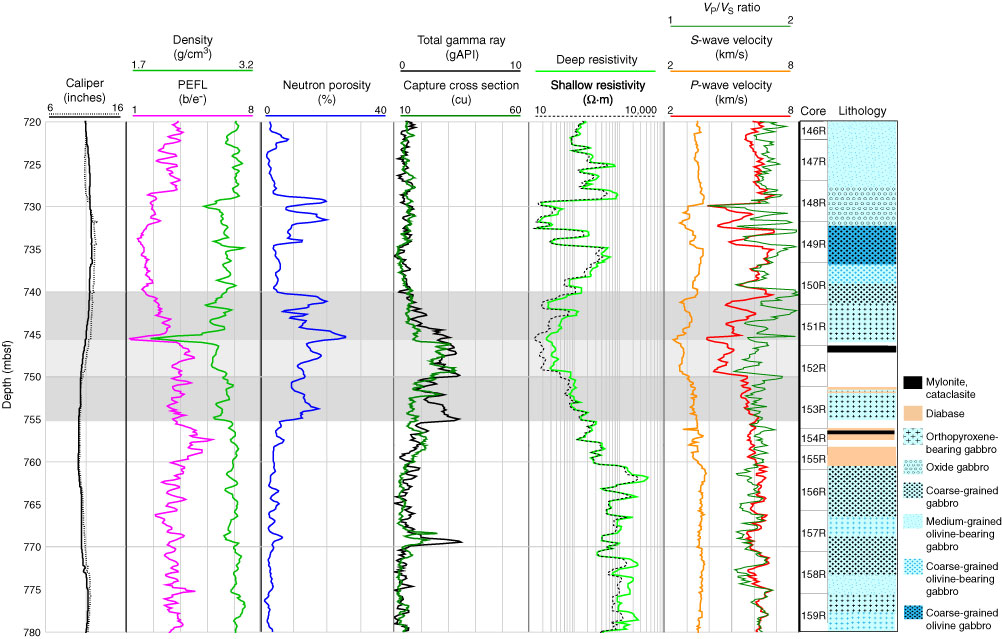
Figure F300. Selected depth interval from 720 to 780 mbsf showing the variation of log responses for a distinct fault zone. It appears the zone was not fully recovered in Core 305-U1309D-152R; logging data show the main zone at 747–750.5 mbsf (gray shading), but, based on increased total gamma ray, sigma, and neutron porosity, they also indicate that a larger depth interval (740–755 mbsf; dark gray shading) is affected by increased alteration. PEFL = photoelectric factor.
Previous | Close | Next | Top of page