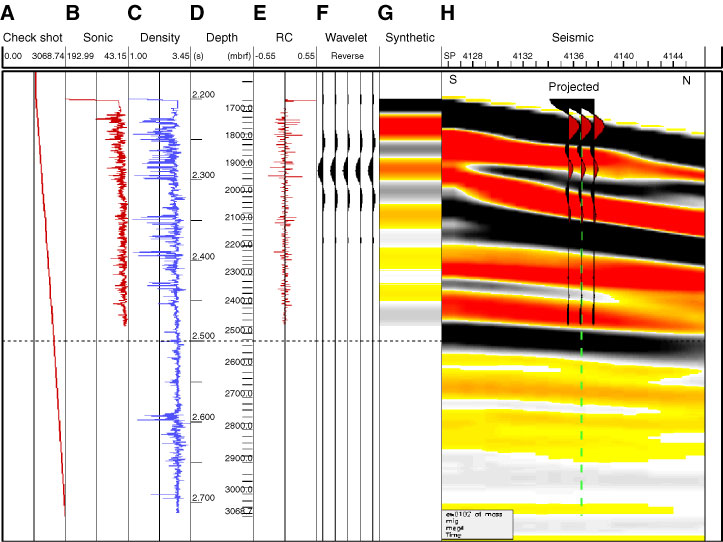
Figure F32. Synthetic seismogram model derived from Hole U1309D logging measurements and comparison to a section of MCS reflection Line Meg-4. A. Two-way traveltime-to-depth based on VSP check shot data to 750 mbsf and an assumed value at 1415 mbsf. B. Conversion of logging P-wave velocity to traveltime at depth. C. Logging bulk density. D. Time-depth scales. E. Reflectivity model derived from data from B and C with bottom velocity value assumed. RC = reflectivity coefficient, which indicates impedance contrast. F. Wavelet that is convolved with reflectivity model to calculate synthetic seismogram. G. Resulting synthetic seismogram. H. Synthetic seismogram trace overlain on section of MCS Line Meg-4 at projected location of Hole U1309D. SP = shotpoint.

Previous | Close | Next | Top of page