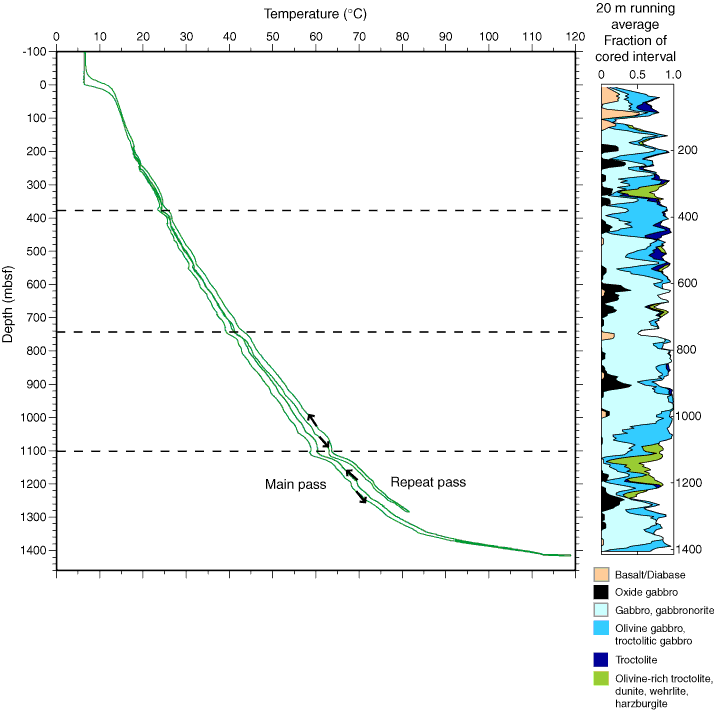
Figure F34. Temperature recorded by the TAP tool. Increase in borehole temperature with time can be seen in downhole versus uphole logging runs and between the main and repeat logging passes. Dashed lines indicate the location of consistent dips in temperature, the lower two of which are located where a fault zone is inferred to occur.

Previous | Close | Next | Top of page