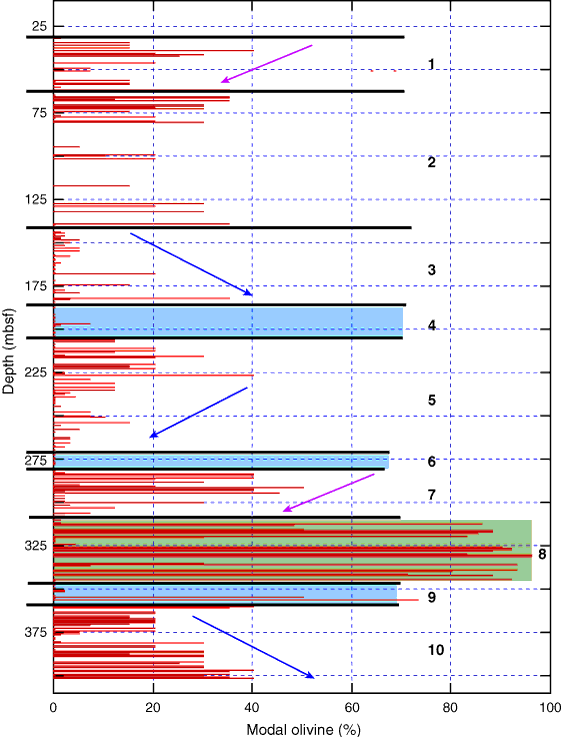
Figure F53. Downhole plot of modal olivine percentages for upper 400 m in Hole U1309D. Black bars = gabbro zone boundaries (Fig. F48), numbers = number of gabbro zone. Arrows = probable within-zone trends. Blue = dominantly gabbros, green = dominantly dunite and olivine-rich troctolite.

Previous | Close | Next | Top of page