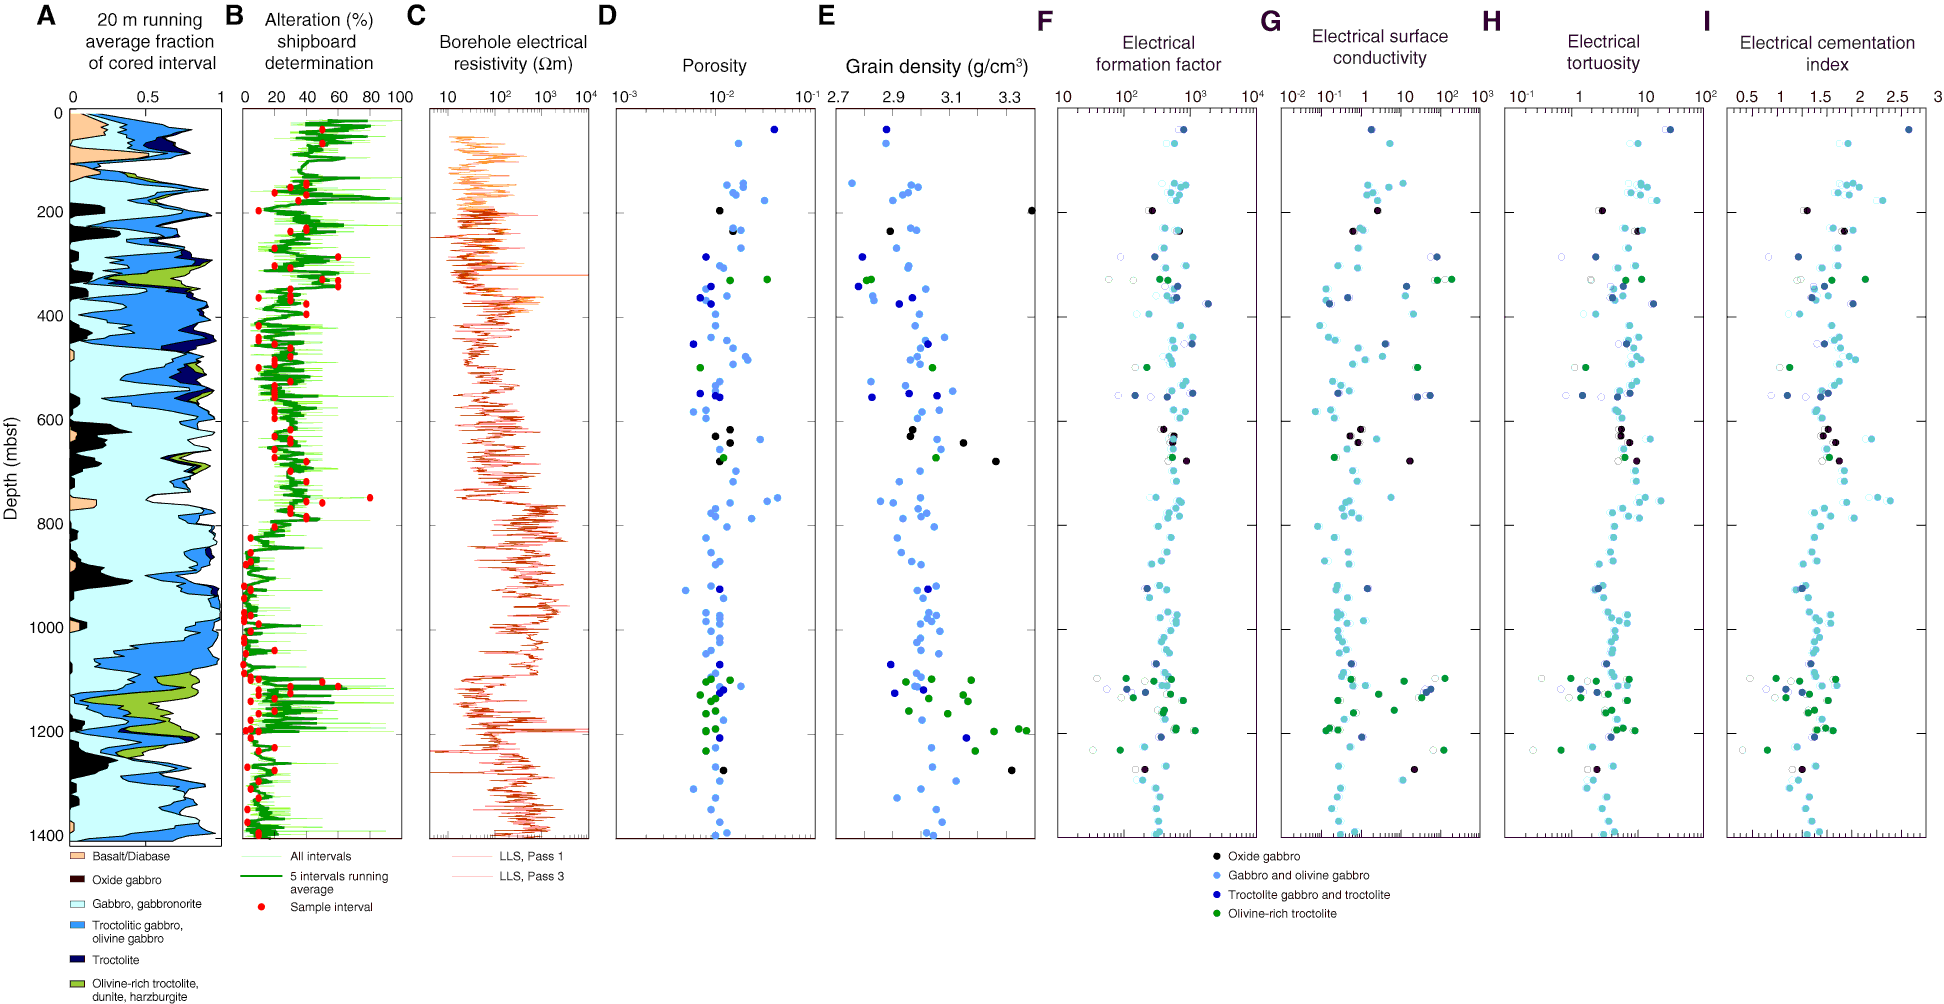
Figure F3. Compared downhole distributions of (A) lithology, (B) hand sample alteration, (C) borehole electrical resistivity, (D) porosity (ϕ), (E) grain density, and (F–I) electrical properties of formation factor (F), surface conductivity (CS), tortuosity (τ), and cementation index (m). Open circles = Waxman and Smits (1968) model, solid circles = Revil and Glover (1998) model. LLS = shallow laterolog.

Previous | Close | Next | Top of page