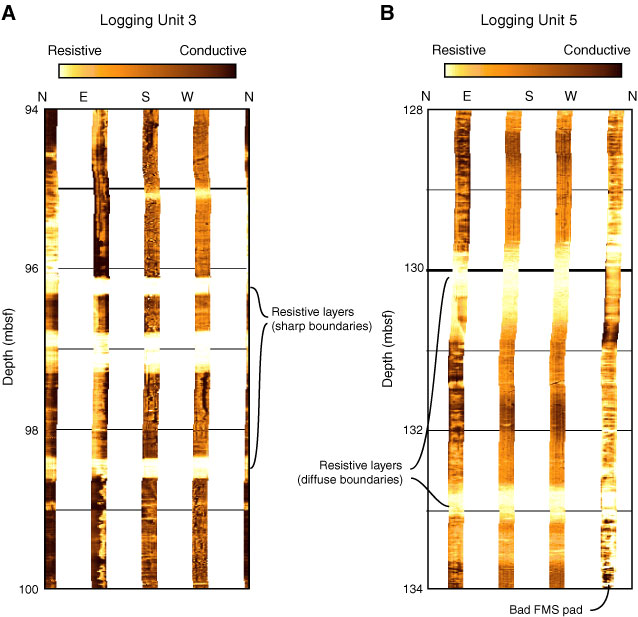
Figure F38. Example of bedding characterization for Formation Microscanner (FMS) images of depth intervals 92–102, 112–122, and 125–135 mbsf. Resistive zones are in light yellow. Conductive zones are in dark brown. Many of the highly resistive layers are characterized by a bedding dipping to the southeast.

Previous | Close | Top of page