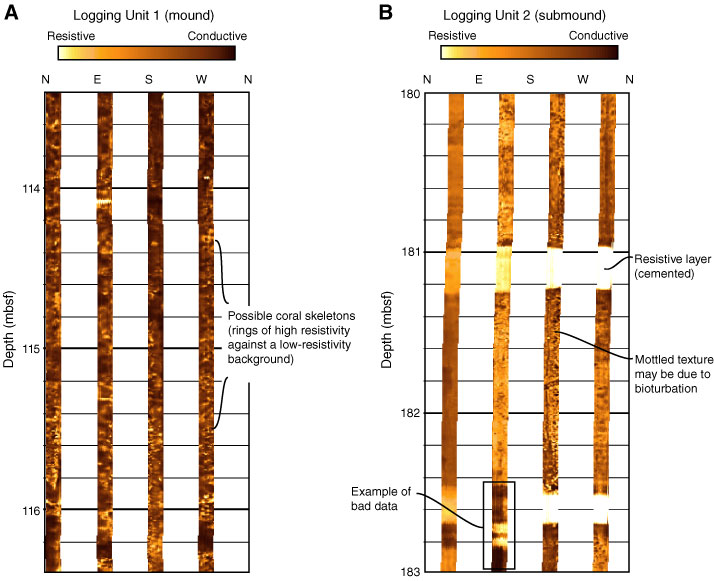
Figure F37. Dynamic normalization of FMS images between 113.4–116.4 and 180–183 mbsf to compare the difference in texture of the two distinct logging Units 1 and 2. Light yellow = resistive zone, dark brown = conductive zone.
Previous | Close | Top of page