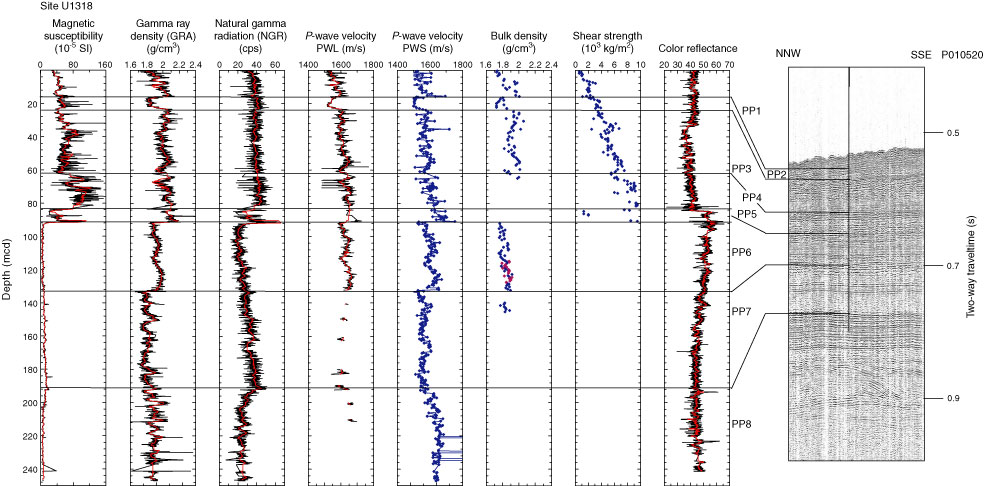
Figure F22. Overview of the spliced depth curves for physical properties correlated with local sparker seismics (P010520). Bulk density plotted by hole. Blue = Hole U1318A, red = Hole U1318B. GRA = gamma ray attenuation, PWL = P-wave logger, PWS = P-wave sensor, red line = running mean.
Previous | Close | Next | Top of page