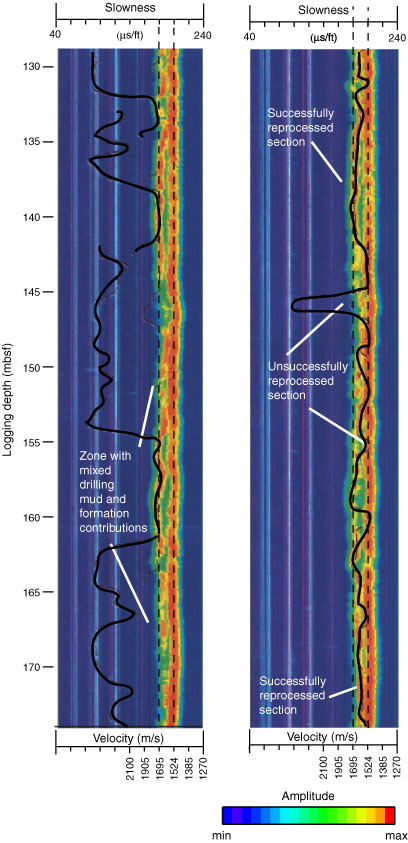
Figure F29. Slowness time coherence plots, showing examples of the problem encountered by the P-wave labelling algorithm in “slow” sediments, where the formation velocity approaches those of the drilling mud. Left panel shows original picking, right panel shows reprocessed picking. Black lines = wave labeling algorithm results.
Previous | Close | Next | Top of page