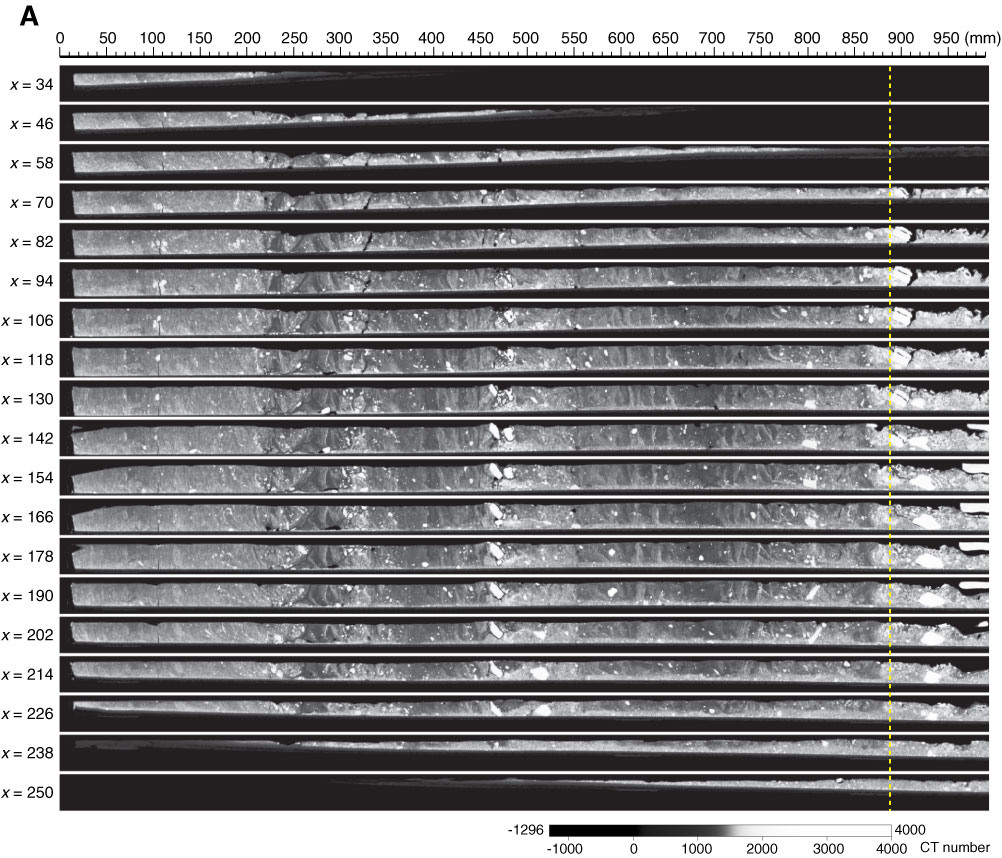
Figure F6. Cross section X-ray computerized tomography (CT) images, Section 307-U1316A-6H-4. Core top is to the left. Yellow dashed line = lithologic Subunit 2A/2B boundary. A. Every 12 intervals, y–z plane, 0–99 cm. (Continued on next two pages.)
Previous | Close | Next | Top of page