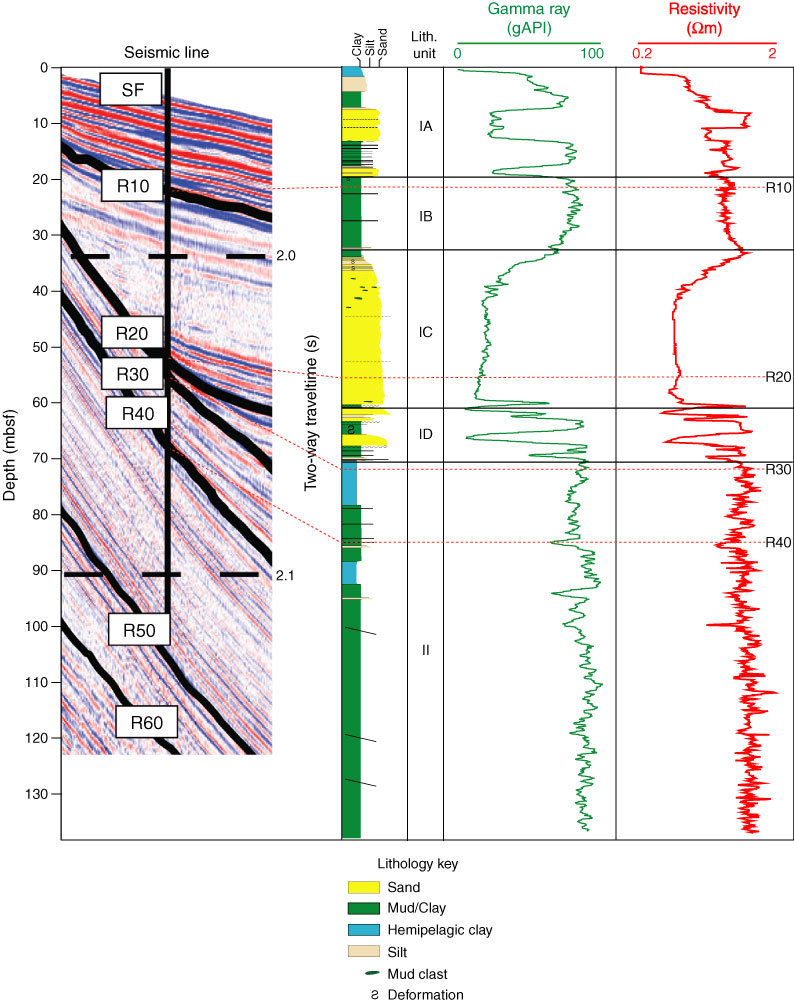
Figure F15. Combination diagram showing seismic strip chart, lithologic column interpreted from logging data, downhole variations of gamma ray intensity and resistivity, and log porosity at Site U1321. The time-depth correlation was achieved by converting wireline logs in time using the check shots obtained in Hole U1320A. SF = seafloor.
Previous | Close | Next | Top of page