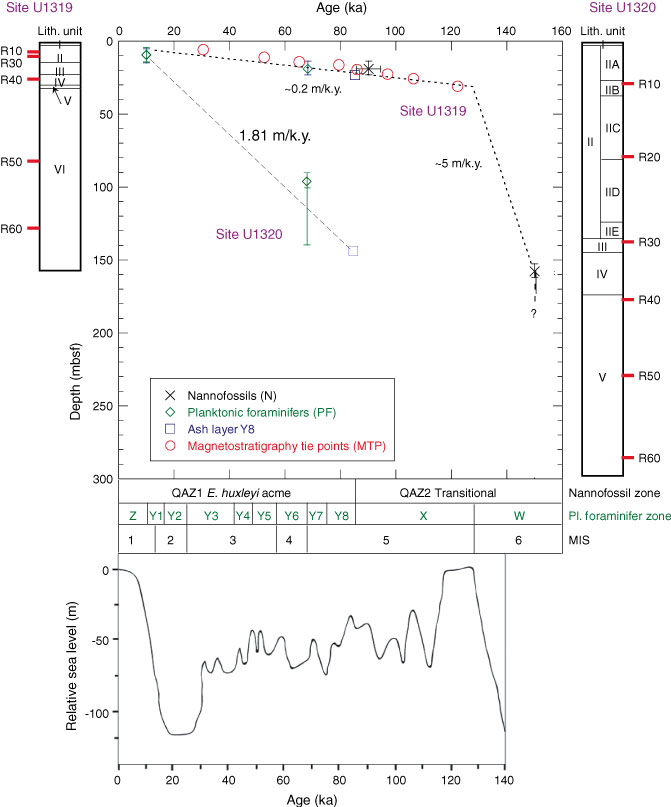
Figure F28. Preliminary age model of Brazos-Trinity Basin IV, integrating results from planktonic foraminifers, nannofossils, and magnetostratigraphy. Lower part of the diagram shows the sea level curve of Lambeck and Chappel (2001). MIS = marine isotope stage.
Previous | Close | Next | Top of page