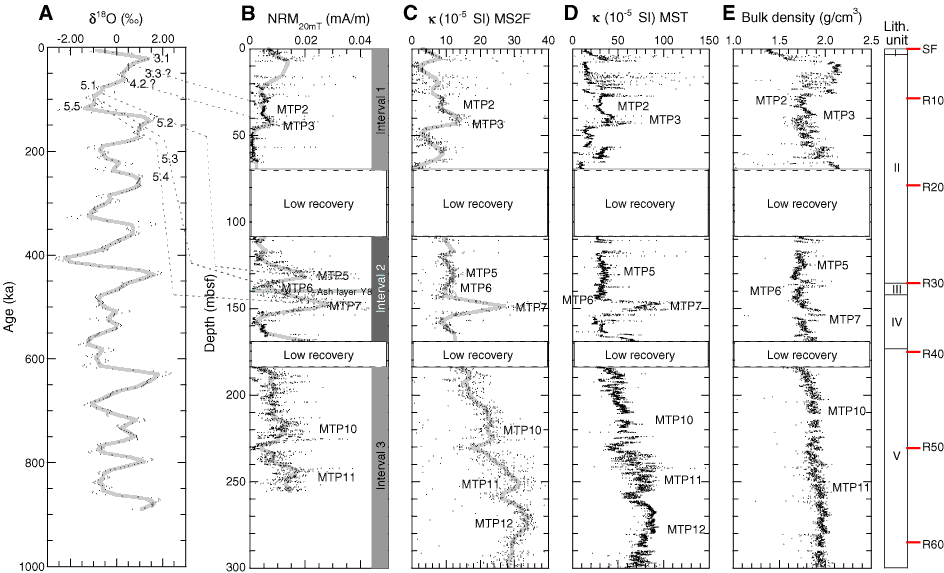
Figure F17. Preliminary magnetostratigraphic age model for Hole U1320A. A. δ18O record (Bassinot et al., 1994) vs. age. Marine isotopes Stages 3.1 through 5.5 are shown. B. NRM20mT intensity, showing the graphical correlation of the magnetostratigraphic tie points (MTP2–MTP12) with marine isotopic stages. C. MS2F sensor magnetic point susceptibility (κ) performed on archive-half cores at 10 cm resolution. D. Multisensor track (MST) κ performed on whole cores at 1 cm resolution measurements. E. Bulk density. Depths have been corrected for voids in the core; lithostratigraphic units, and seismic reflectors (SF = seafloor) are also shown.

Previous | Close | Next | Top of page