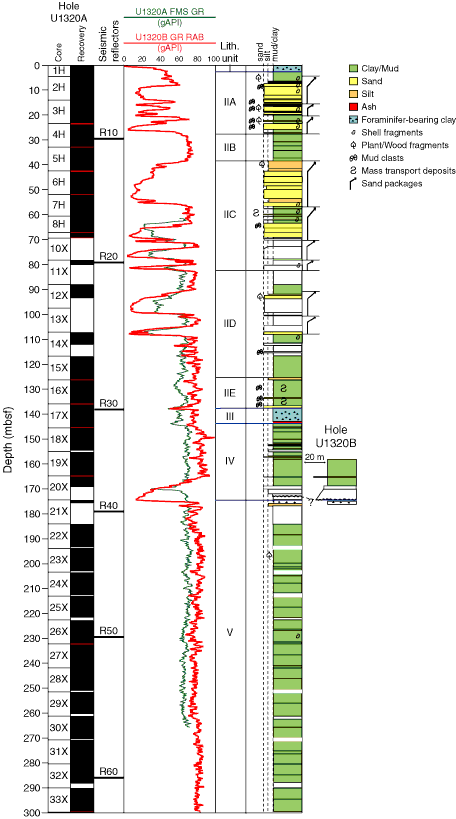
Figure F2. Lithostratigraphic summary. Core recovery (black = recovered, white = missing, red = overlapping due to core expansion), key seismic reflectors, Formation MicroScanner (FMS) and resistivity-at-the-bit (RAB) gamma ray (GR) logs. A slight depth shift was applied to the FMS data to match the unshifted RAB GR log. Colors and width of boxes indicate lithology and grain size, respectively. Clear boxes represent inferred lithology from MWD/LWD gamma ray logs. Bends at the top of sand package symbols represent fining upward. Differences between the cored hole (U1320A) and the logged hole (U1320B) are shown in the middle of the diagram, where local erosion is interpreted to explain the differences in log character.
Previous | Close | Next | Top of page