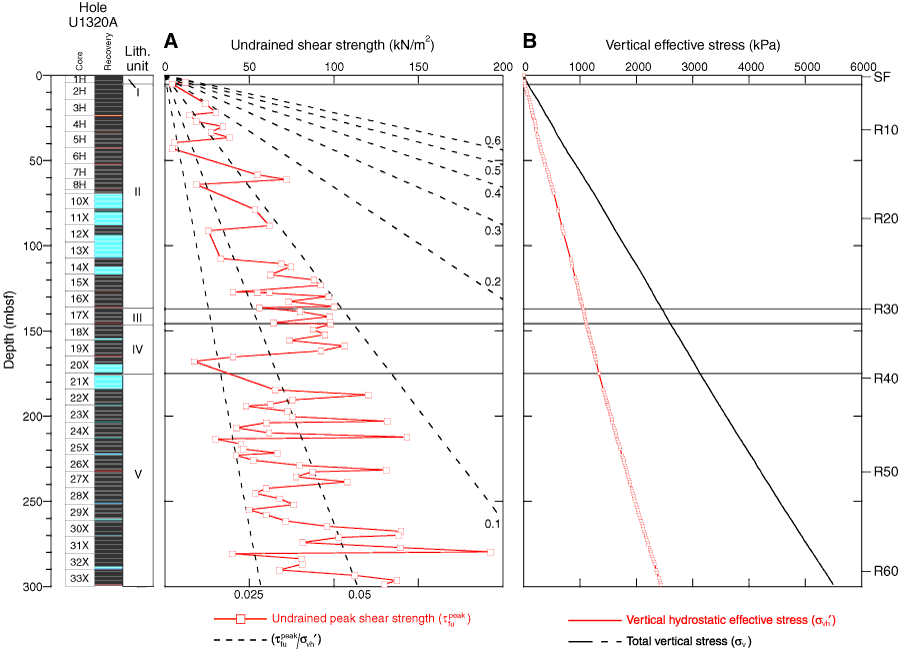
Figure F32. (A) Comparison between the undrained peak shear strength (red squares) and isolines representing constant peak shear strength to vertical hydrostatic effective stress (σvh′) ratios and (B) vertical hydrostatic effective stress (σvh′) and total vertical stress (σv) based on hydrostatic conditions, along with lithostratigraphic units and seismic reflectors (SF = seafloor).

Previous | Close | Next | Top of page