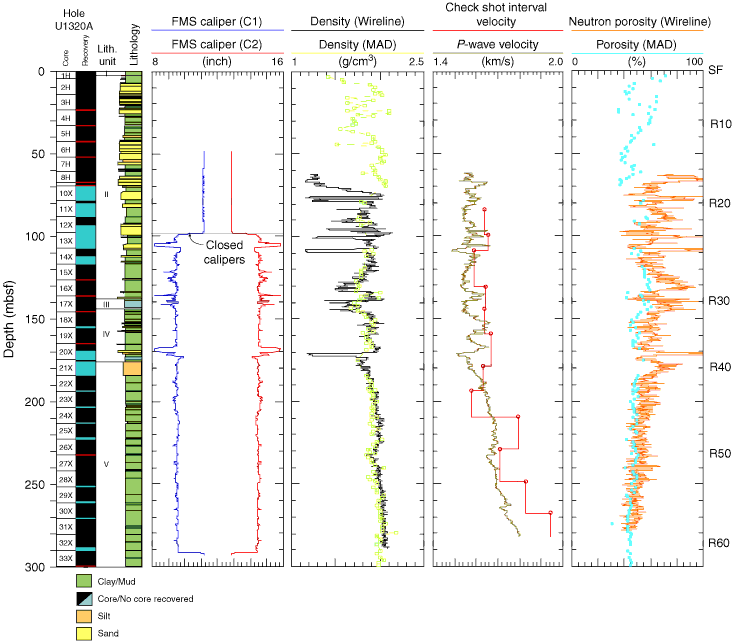
Figure F34. Lithostratigraphy and wireline logs showing Formation MicroScanner (FMS) caliper, density, compressional wave velocity, and porosity measurements. Shipboard density and porosity measurements (MAD) are also shown as discrete points. Seismic reflectors are correlated to logging data (SF = seafloor). Velocities obtained with the WST check shot are denoted as red circles and plotted with the compressional wave velocity profile from the DSI.

Previous | Close | Next | Top of page