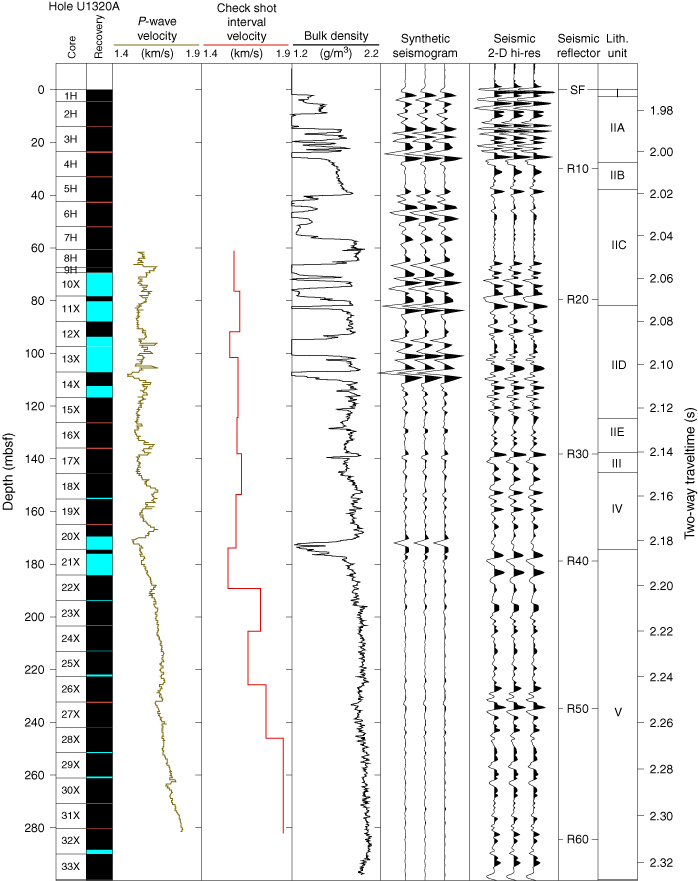
Figure F36. Velocity-depth plot of Hole U1320A showing wireline sonic and check shot interval velocities. Bulk density data from Hole U1320B are shown in column 3. A synthetic seismogram was constructed by convolving a 200 Hz minimum-phase Ricker wavelet with the reflection coefficient series based on LWD bulk density and a constant velocity (1600 m/s). A seismic high-resolution trace (Hi-Res) is extracted from 2-D high-resolution multichannel seismic data at the location of Site U1320 (see also Figs. F43, F45; Table T13). SF = seafloor.

Previous | Close | Next | Top of page