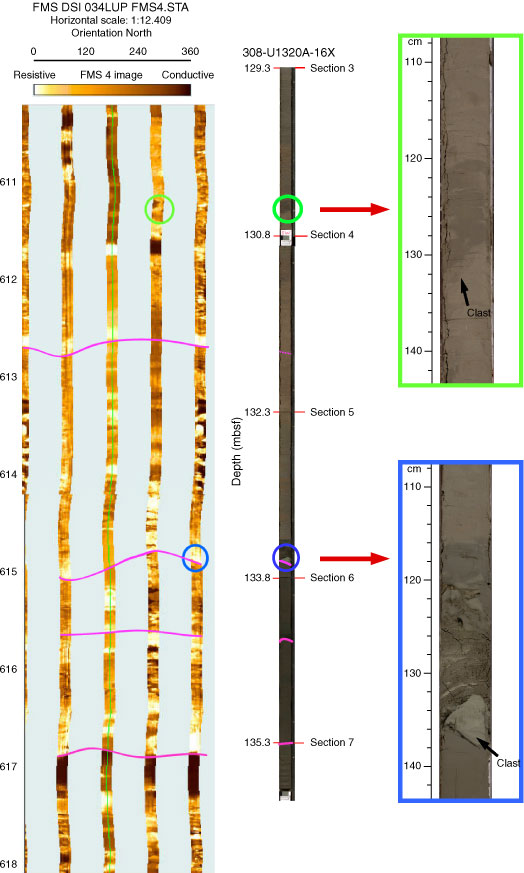
Figure F4. Correlation between core and Formation MicroScanner (FMS) borehole image for an interval in lithostratigraphic Subunit IIE interpreted as a mass transport deposit. Steep, variable dip bedding surfaces can be seen in both core and FMS images, together with clasts of various sizes.
Previous | Close | Next | Top of page