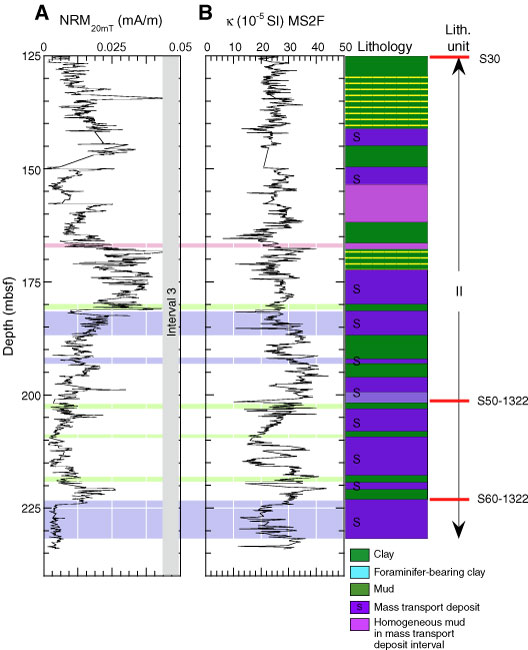
Figure F25. Detailed close-up of the potential correlation of (A) natural remanent magnetization after 20 mT AF demagnetization (NRM20mT) and (B) magnetic susceptibility compared to the lithologic changes in lithostratigraphic Unit II (125–235 mbsf). Peaks in both records often coincide with a change in lithology, but no general correlation pattern is apparent.
Previous | Close | Next | Top of page