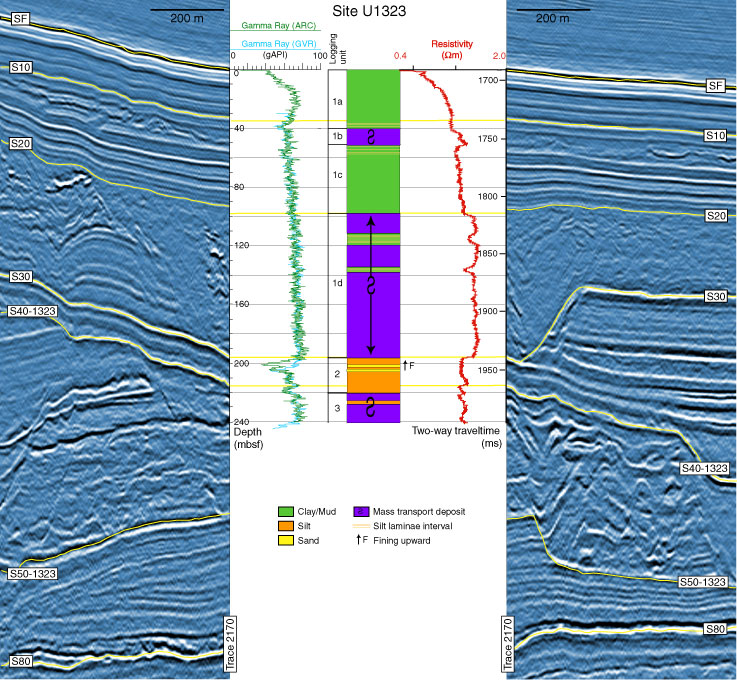
Figure F5. Seismic panel, gamma radiation, log unit/subunit divisions, inferred lithostratigraphic column, resistivity curve (log scale), and depth in two-way traveltime for Hole U1323A. The seismic panel was split at the location of Hole U1323A at trace 2170. Seismic data are approximately zero phase with black = peaks and white = troughs and plotted in depth using the check shot from Hole U1324A. Key seismic reflectors are shown in yellow and labeled (SF = seafloor). GVR = GeoVision Resistivity, ARC = array resistivity compensated.
Previous | Close | Next | Top of page