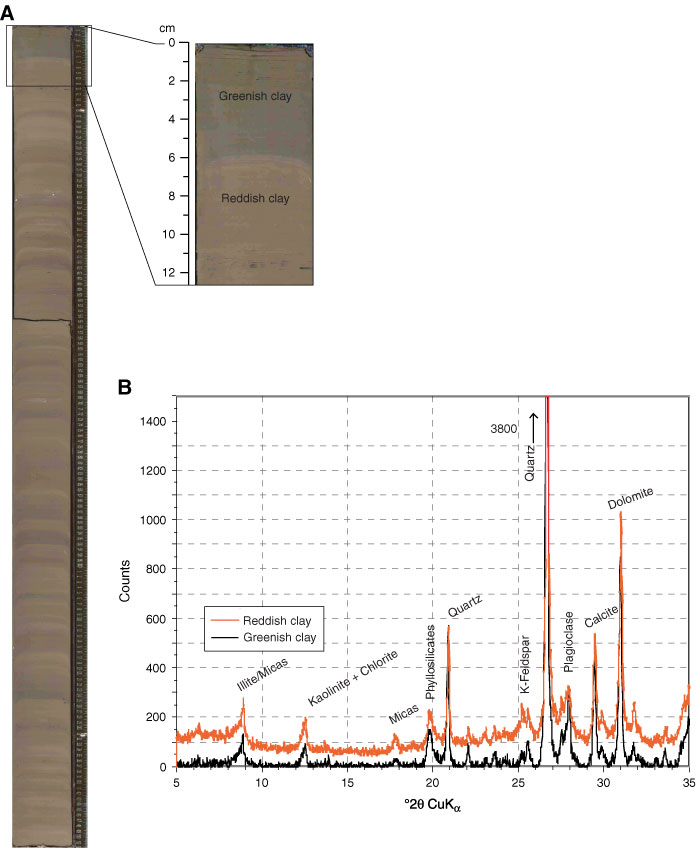
Figure F15. Results of the XRD analysis of two samples from Subunit IC. A. Boundary between greenish and reddish clay (Section 308-U1324B-10H-6). B. XRD multiple diagram shows nearly identical results for single samples from the green clay and from the red clay. Note that the black line has background counts removed and green line has background counts retained in order to compare the two curves.
Previous | Close | Next | Top of page