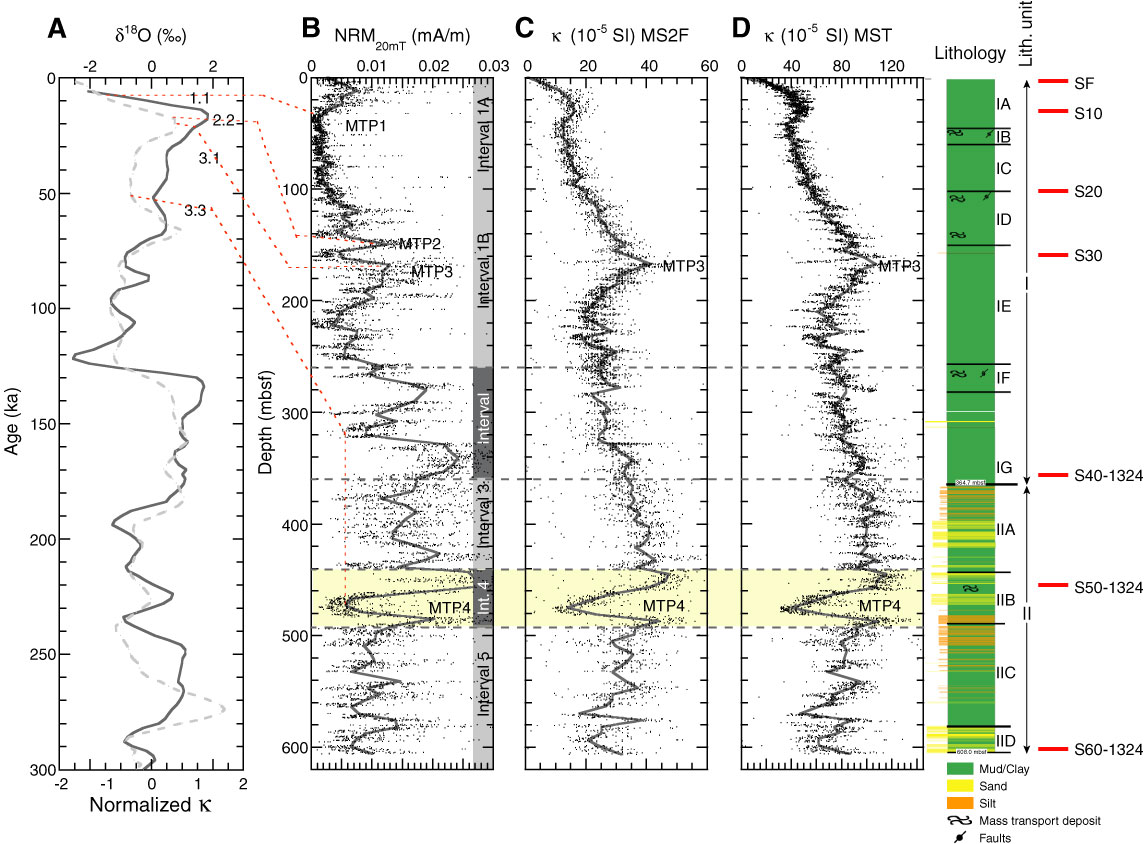
Figure F25. Magnetostratigraphic data (black dots) and running average (gray lines) of Hole U1324B. A. δ18O record (Bassinot et al., 1994, solid line) and Subtropical South Atlantic Susceptibility stack (von Dobeneck and Schmiedert, 1999, dashed line) vs. age, and marine isotope stages (MIS) 1.1, 2.2, 3.1, 3.3. B. Natural remanent magnetization after 20 mT AF demagnetization (NRM20mT), showing the graphical correlation of the magnetostratigraphic tie points (MTP1–MTP4) with marine isotopic stages. C. MS2F sensor magnetic point susceptibility (κ) performed on archive halves at 10 cm resolution. D. Multisensor track (MST) κ measured on whole cores at 6 cm resolution. Depths have been corrected for voids in the core; lithostratigraphic units, magnetostratigraphic intervals, and seismic reflectors (SF = seafloor) are also shown.
Previous | Close | Next | Top of page