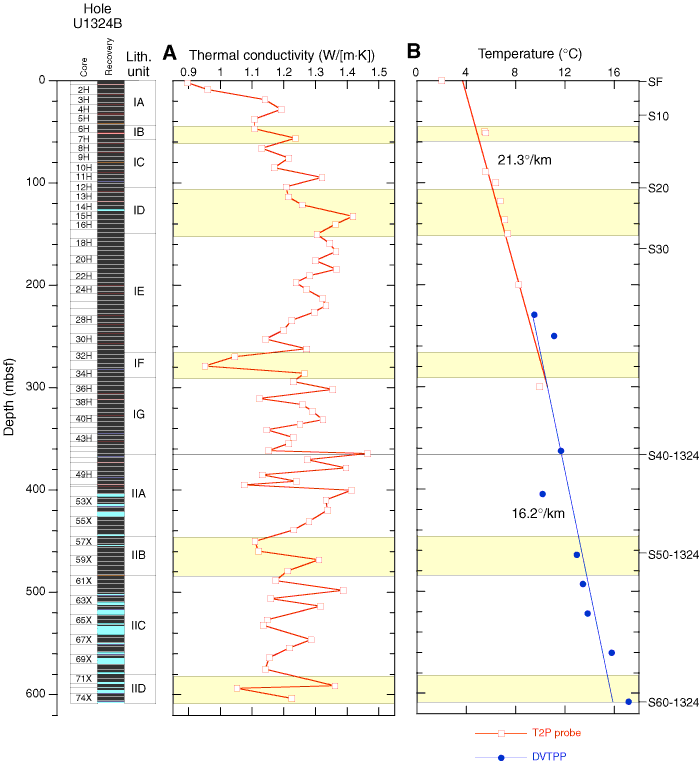
Figure F37. A. Thermal conductivity. B. In situ temperatures measured using the temperature/dual pressure (T2P) probe and Davis-Villinger Temperature-Pressure Probe (DVTPP), plotted along with seismic reflectors (SF = seafloor). Yellow = mass transport deposits.

Previous | Close | Next | Top of page