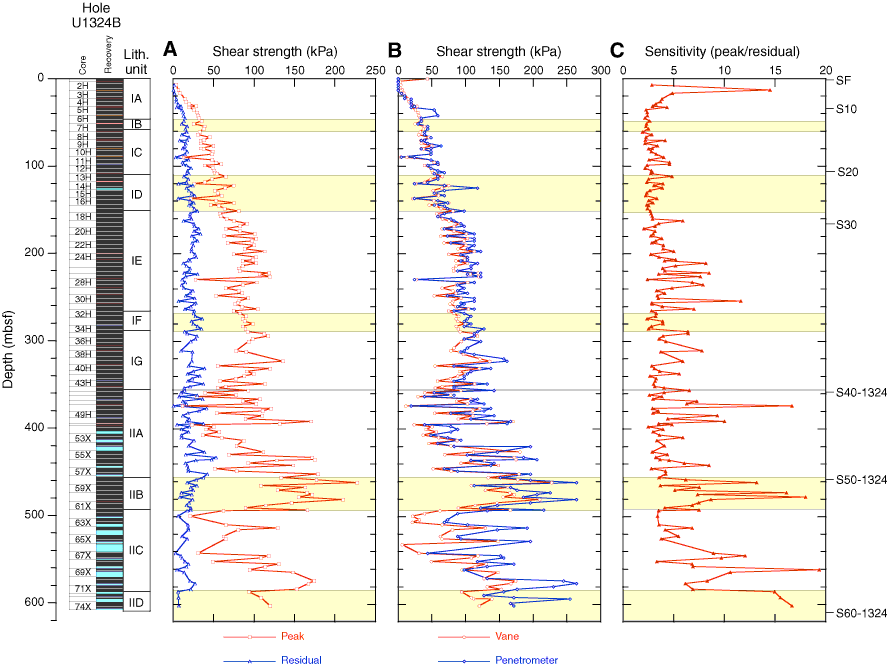
Figure F39. A. Peak and residual undrained shear strength from vane shear tests. B. Comparison of the peak undrained shear strengths measured by the shear vane and the pocket penetrometer. C. Sensitivity. Seismic reflectors (SF = seafloor; see “Background and objectives”) are shown. Yellow = mass transport deposits.

Previous | Close | Next | Top of page