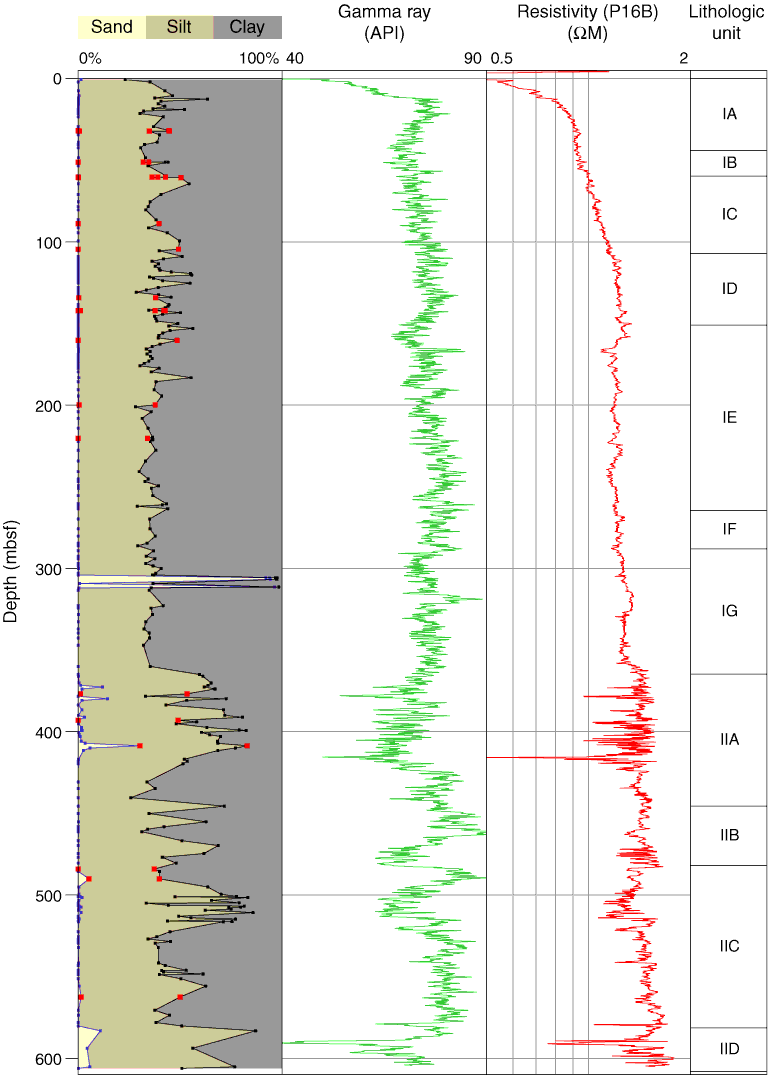
Figure F7. Downcore profile of particle distribution, Site U1324. Red squares = MIT measurements. Gamma ray and resistivity (P16B) logs are from wireline data. Lithologic units were defined by shipboard sedimentologists (see the “Site U1324” chapter).
Previous | Close | Next | Top of page