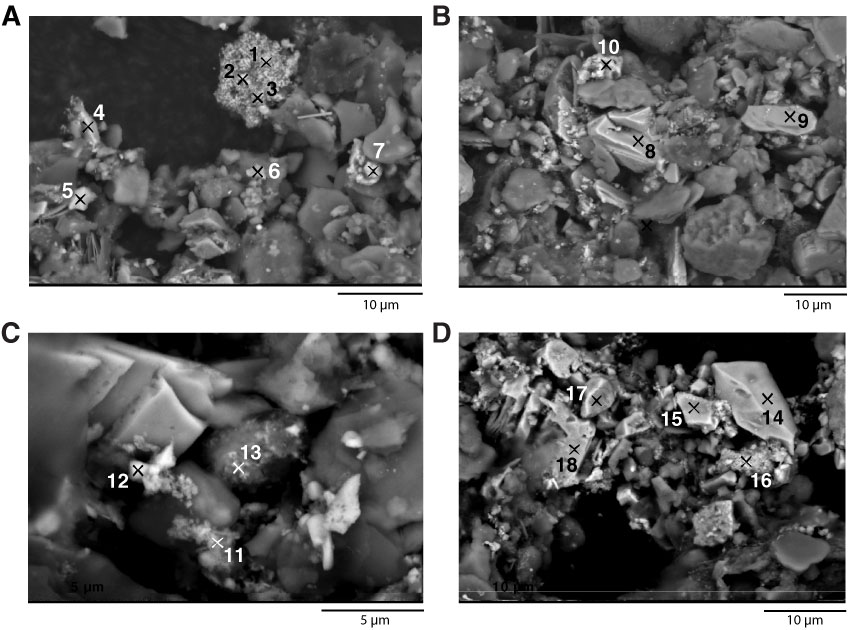
Figure F8. SEM micrographs of (A, B) Samples 308-U1319A-2H-CC (14.4 mbsf) and (C, D) 308-U1319A-3H-CC (23.8 mbsf). See “SEM analyses of the magnetic mineral assemblage (Hole U1319A)” for description of numbered particles.
Previous | Close | Top of page