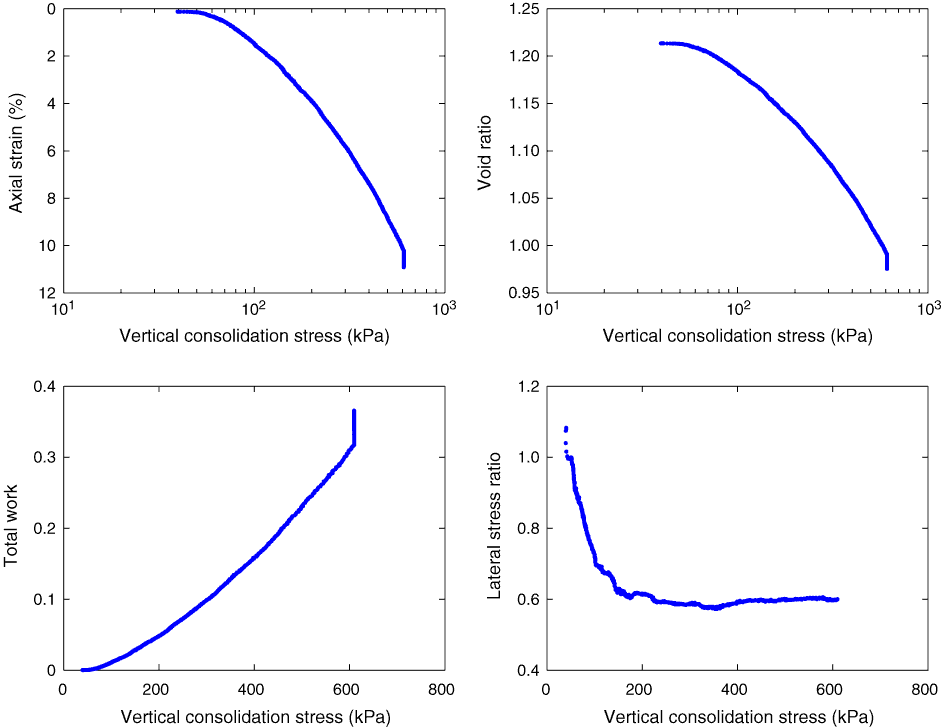
Figure F3. Example data from the consolidation phase of triaxial experiment TX729. Axial strain and void ratio vs. vertical consolidation are plotted on a logarithmic scale that can be used to define stress-strain behavior. Total work and lateral stress ratio (Ko) vs. vertical consolidation stress are plotted on a linear scale. Work data can be used for interpreting in situ stress conditions. Ko data define how horizontal stress changes during uniaxial (no radial strain) loading.
Previous | Close | Next | Top of page