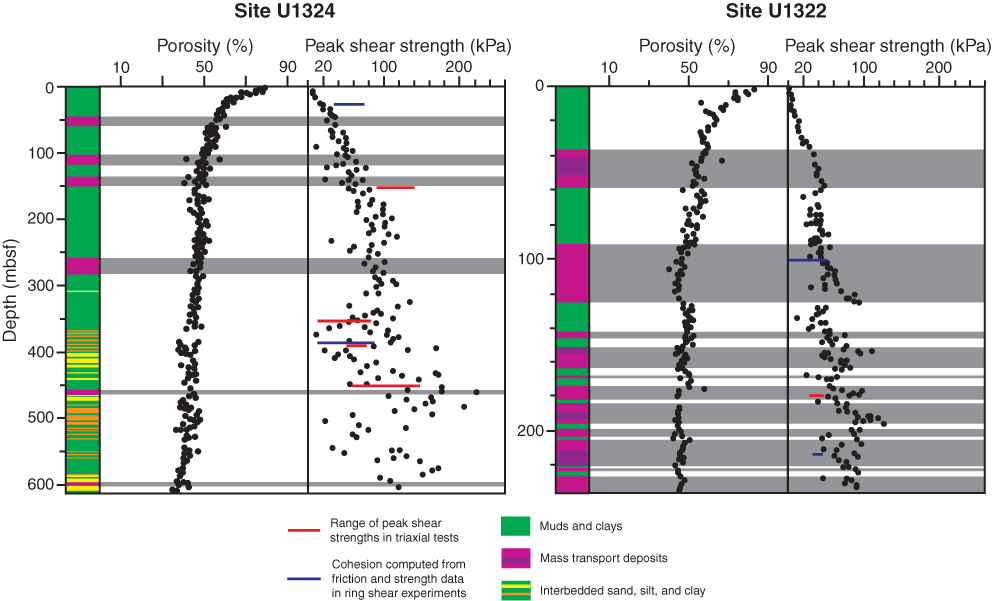
Figure F1. Lithology, porosity, and peak shear strength measurements vs. depth for Sites U1322 and U1324 in the Ursa Basin (derived from shipboard data). Compaction-induced decrease of porosity and increase in shear strength with depth are clearly seen. Note high gradients near bases of some mass transport deposits. Blue bars = cohesion estimated from strength and frictional behavior of ring shear tested samples, red bars = ranges of peak shear strengths observed in triaxially tested material.
Close | Next | Top of page