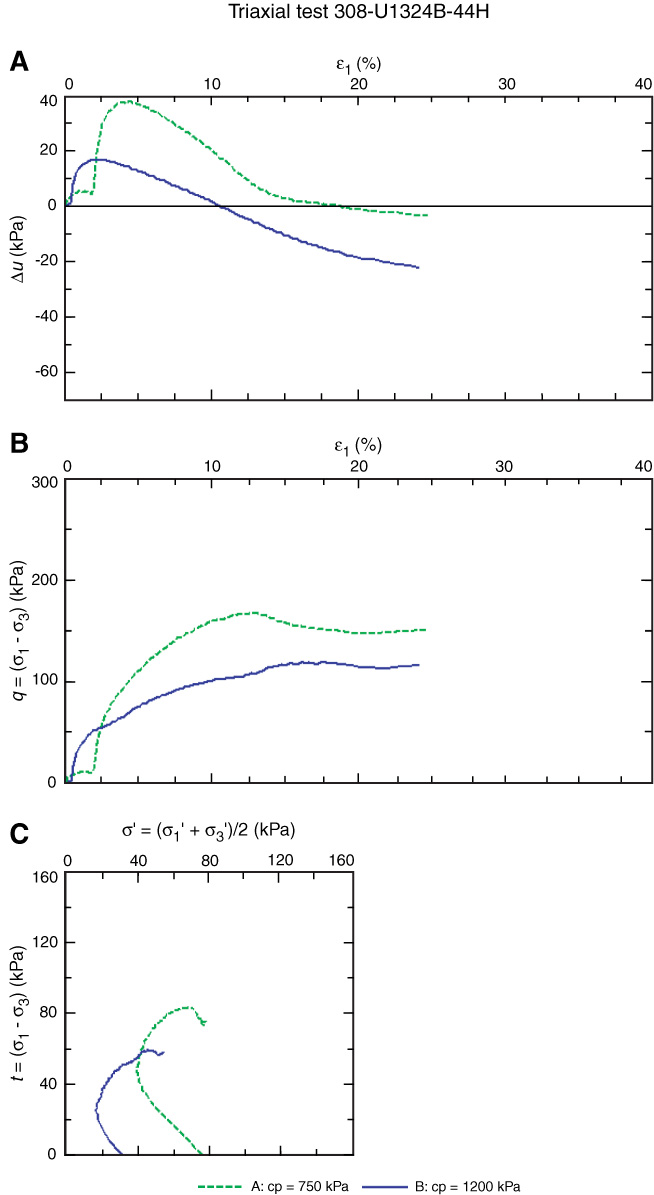
Figure F3. Triaxial test data of Sample 308-U1324B-44H-1, 100–120 cm, sedimentation by suspension fallout. A. Change in pore water pressure vs. axial strain. B. Deviatoric stress vs. axial strain. C. Effective stress path. cp = cell pressure.

Previous | Close | Next | Top of page