Close | Next
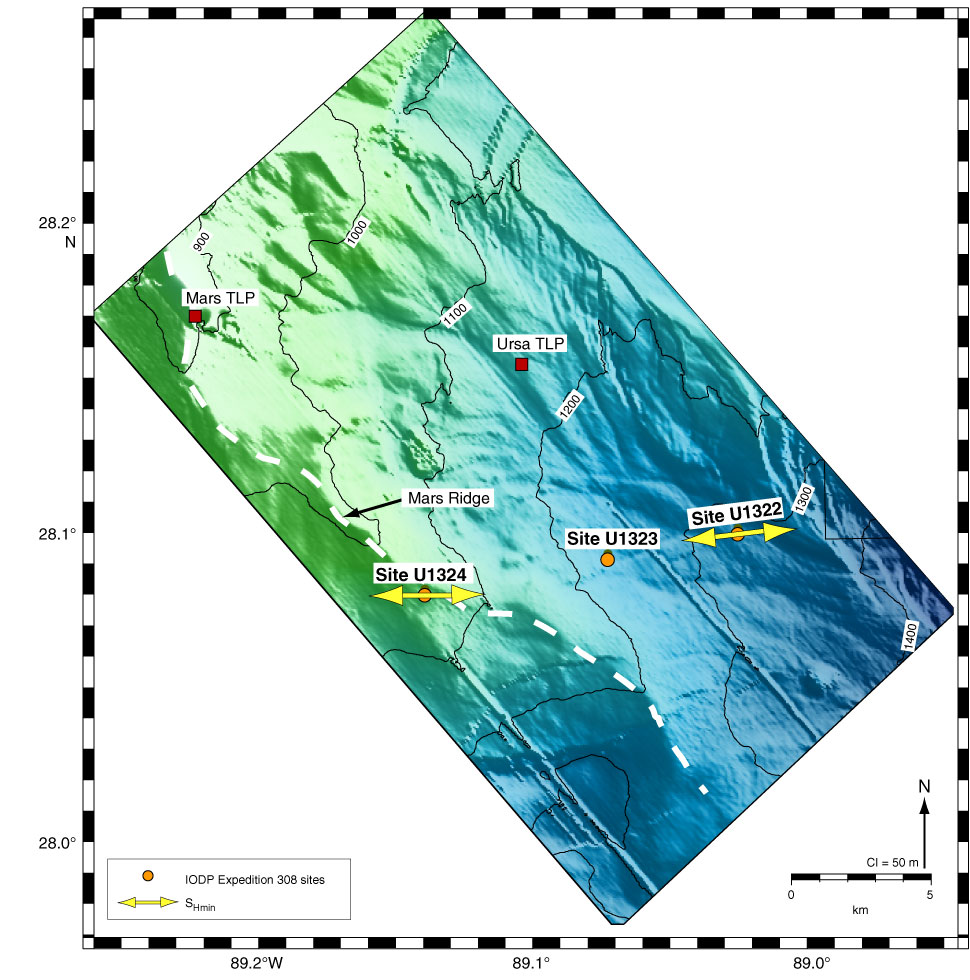
Figure F1. Sidelit bathymetry (meters below sea level) of Ursa region mapped from three-dimensional seismic data. Illumination is from the northwest. TLP = tension leg platform. CI = contour interval.
Close | Next | Top of page