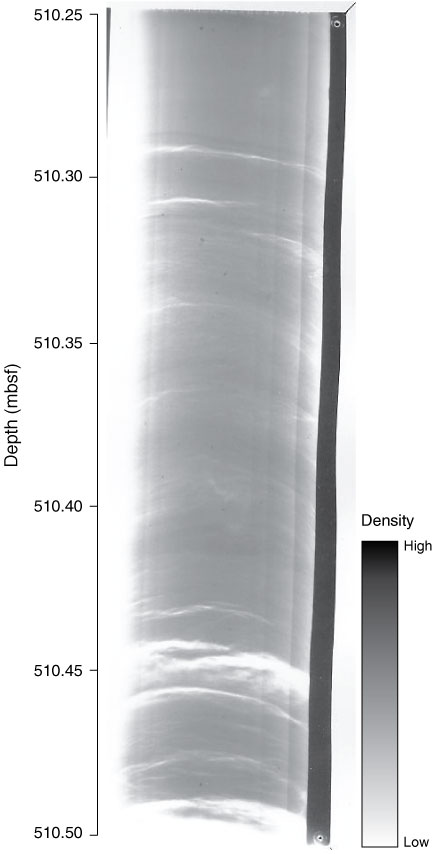
Figure F6. Negative radiograph (see Table T1) from Ursa Basin, Site U1324 (Sample 308-U1324C-8H-4, 75–100 cm). Radiograph was completed by MIT. Light colors = low densities and are interpreted as voids, dark colors = higher densities typical of sediment.
Previous | Close | Next | Top of page