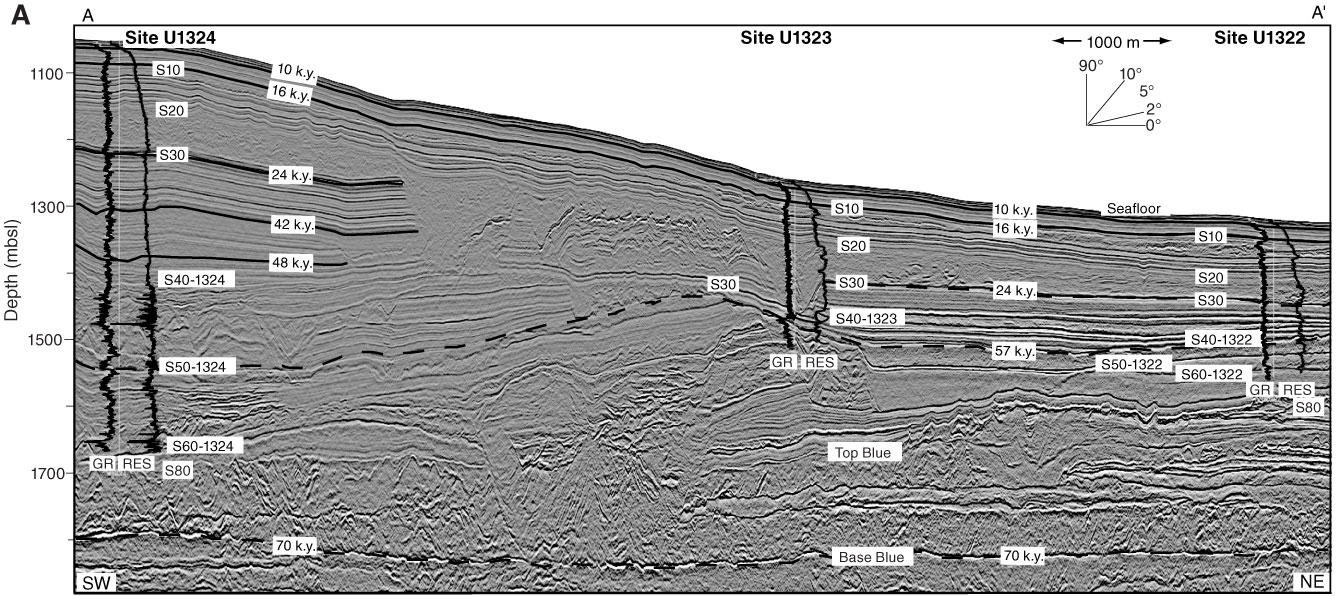
Figure F2. A. Depth-converted seismic cross-section A–A′ tied with Expedition 308 holes. Gamma ray (GR) and resistivity (RES) LWD logs are shown as well as key seismic surfaces. Solid lines represent age-equivalent horizons that have been identified at IODP sites. Dashed lines represent tentative time lines. (Continued on next page.)
Previous | Close | Next | Top of page