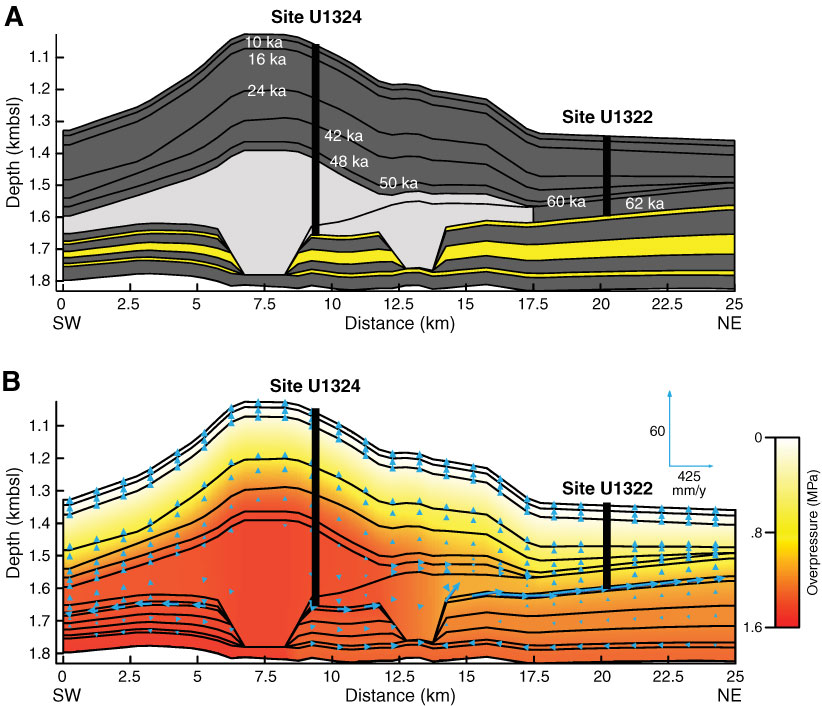
Figure F7. A. 2-D model at present day showing lithologic units and time horizons above the Blue Unit (interbedded yellow and gray layers at base) (Stigall and Dugan, 2010). Dark gray shading represents silty claystone, light gray shading represents clayey siltstone, and yellow shading represents sandstone. B. Color contour plot of overpressure with stratigraphic lines (black) and fluid velocity vectors. Present-day overpressure reaches 1.5 MPa at Site U1324 and 1.1 MPa at Site U1322. Fluid velocity vectors show focused and rapid flow along the high-permeability sandstones in the Blue Unit from west to east (left to right). Figure and caption from Stigall and Dugan (2010).
Previous | Close | Top of page