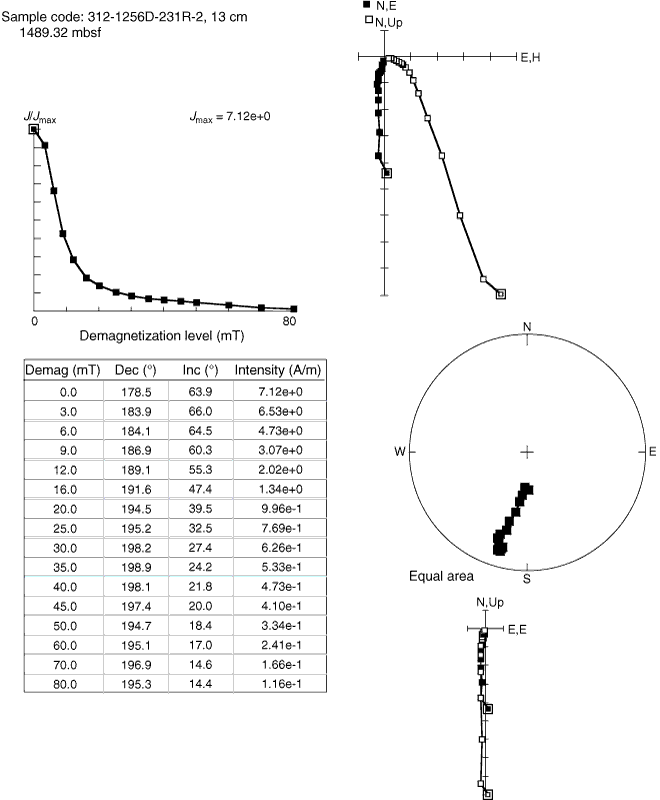
Figure F58. Alternating-field demagnetization behavior of a typical gabbro sample (Thin Section 111; discrete Sample 312-1256D-213R-1, 13–16 cm). Normalized intensity vs. demagnetization level is at upper left; component diagrams and direction plots are on the right.

Previous | Close | Next | Top of page