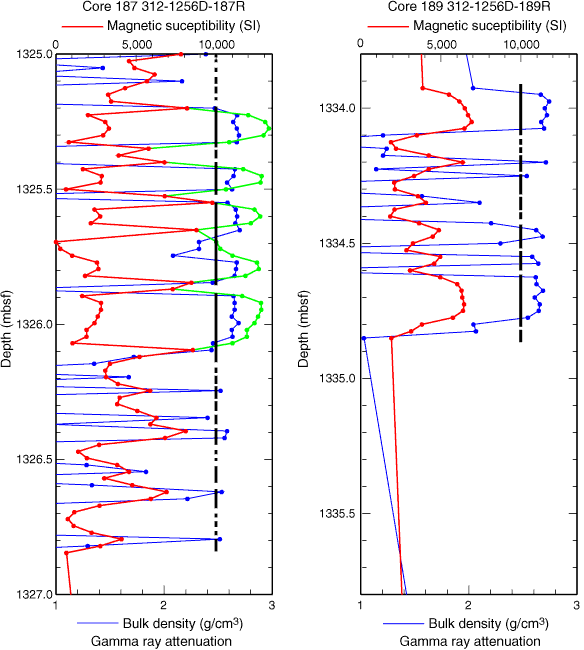
Figure F16. Example of MST logs of a core (Core 312-1256D-187R) for which magnetic susceptibility values reported by the Bartington MS2C loop (red line) were truncated and a core (Core 312-1256D-189R) for which magnetic susceptibility values appear valid. Gamma ray attenuation density values are high in both cores. Broken vertical black line shows the position and length of each rock piece logged; pieces at least 20 cm long are present in both cores. Green line indicates the correct magnetic susceptibility values after addition of 10,000 SI.

Previous | Close | Next | Top of page