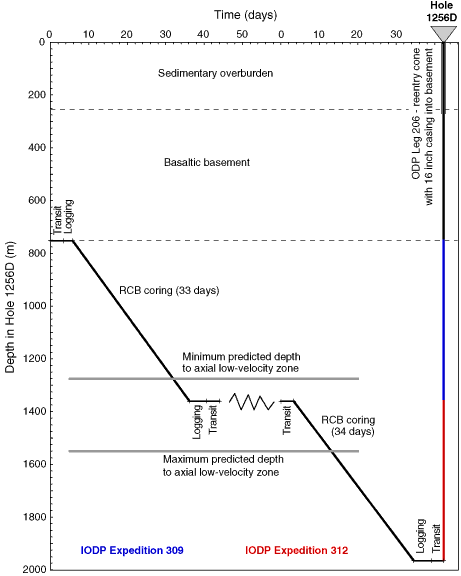
Figure F11. Depth vs. time graph for predicted drilling and wireline logging operations during Expedition 309/312. Solid line shows depth of Hole 1256D before Expedition 309 operations. Horizontal lines show range of depths at which axial low-velocity zones, now frozen as gabbros, should occur, assuming 300 m of off-axis lavas (see Table T1).

Previous | Close | Next | Top of page