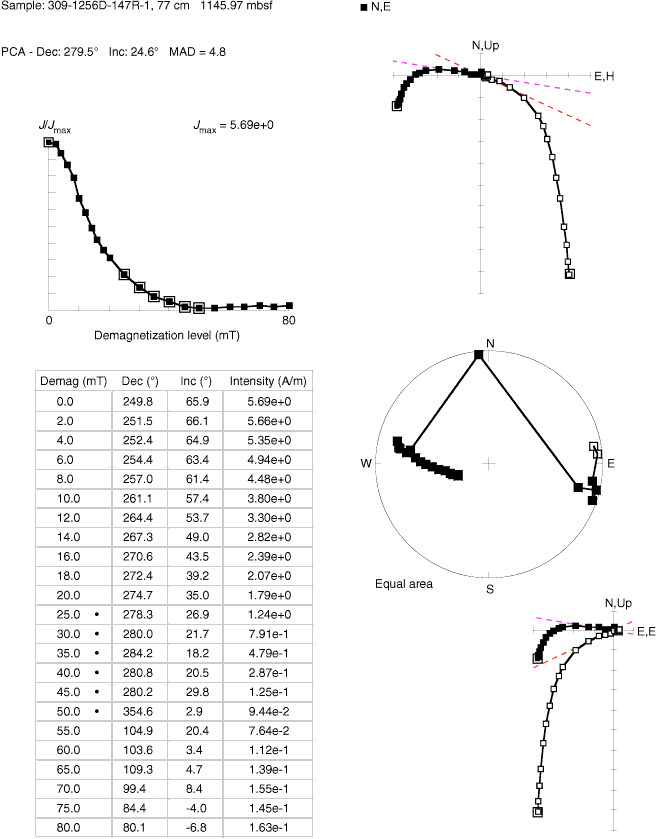
Figure F169. Typical alternating-field demagnetization (demag) behavior of a sample from 1000 to 1255 mbsf. Dots on the data table and double squares on the intensity plot show the values used for principal component analysis (PCA). Directions show a smooth progression toward shallow inclinations but without a clear end point. Dec = declination, Inc = inclination. MAD = maximum angular deviation.

Previous | Close | Next | Top of page