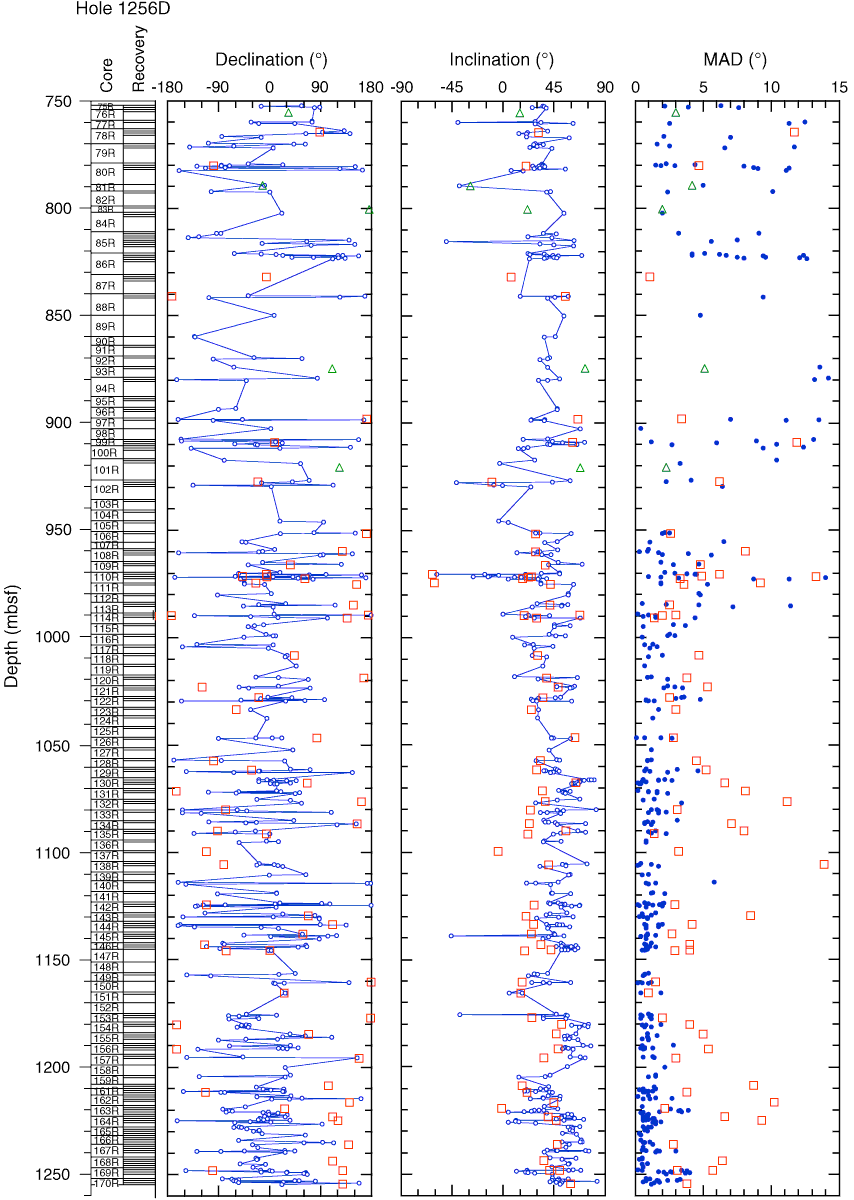
Figure F173. Results of PCA analysis of demagnetization plotted against depth. Line-connected circles = directions from the archive half, squares = alternating-field demagnetization results from the working half, triangles = thermal demagnetization results. MAD = maximum angular deviation. Solid circles on MAD panel = MAD values from archive half.

Previous | Close | Next | Top of page