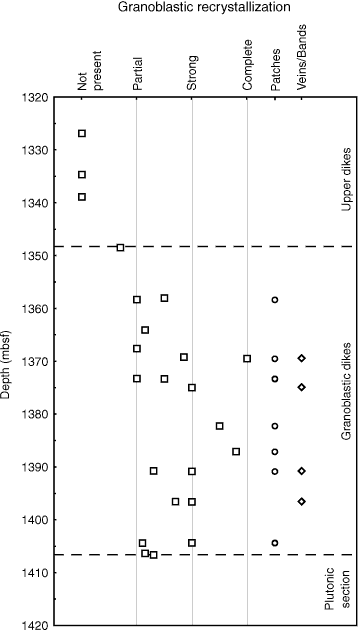
Figure F279. Downhole distribution of granoblastic texture using the classification system shown in Figure F278. Distributions of granoblastic patches and veins/bands are also shown. Data points plotted between two vertical lines are plotted according to the relative proportion of the two textures.

Previous | Close | Next | Top of page