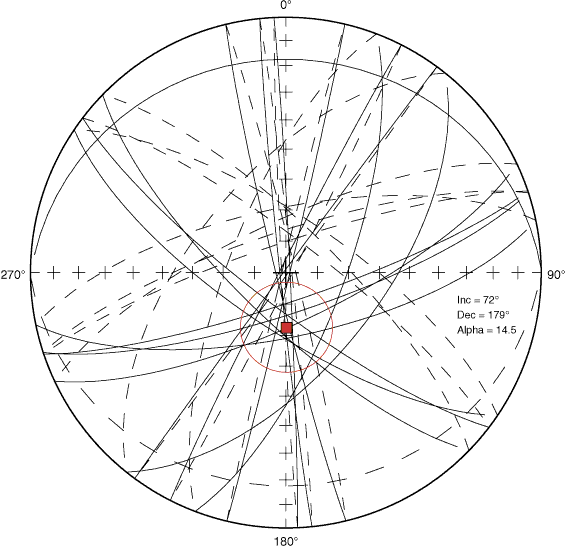
Figure F320. Planes fit to demagnetization trends of representative discrete samples and the direction (square) and confidence region (red circle) defined by their intersection. Tight clustering of plane intersections reflects the shared overprint direction.

Previous | Close | Next | Top of page