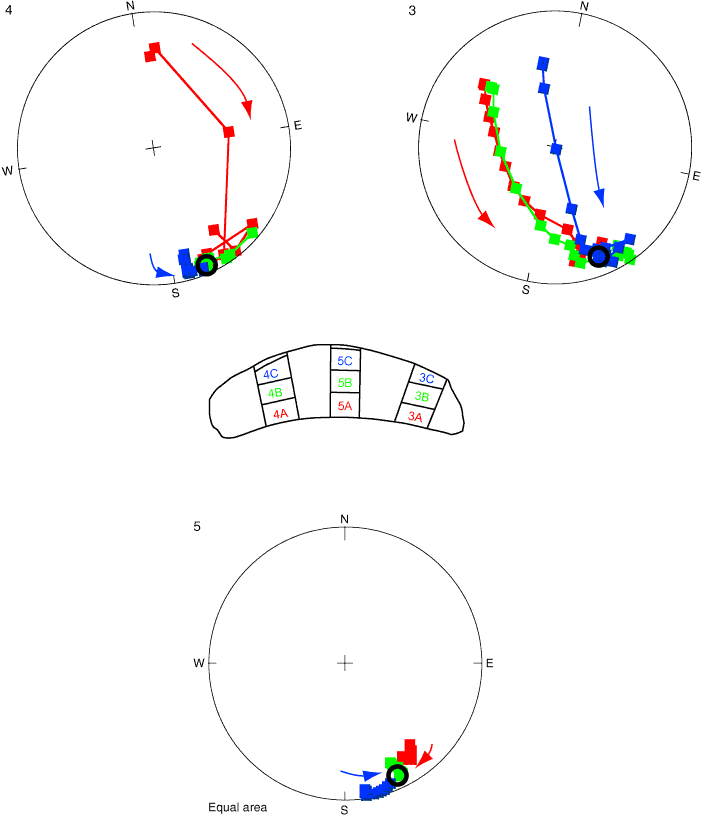
Figure F326. Magnetization direction during demagnetization for samples of the borehole wall fragment (Fig. F325). Sample positions 3, 4, and 5 are shown on separate stereonets, and radial slices are indicated by color. Arrows show trends from NRM to higher demagnetizing fields. Stereonets from samples 3 and 4 have been rotated to match the orientation of sample 5. Magnetization directions after demagnetization (black circles) agree well between all samples.

Previous | Close | Next | Top of page