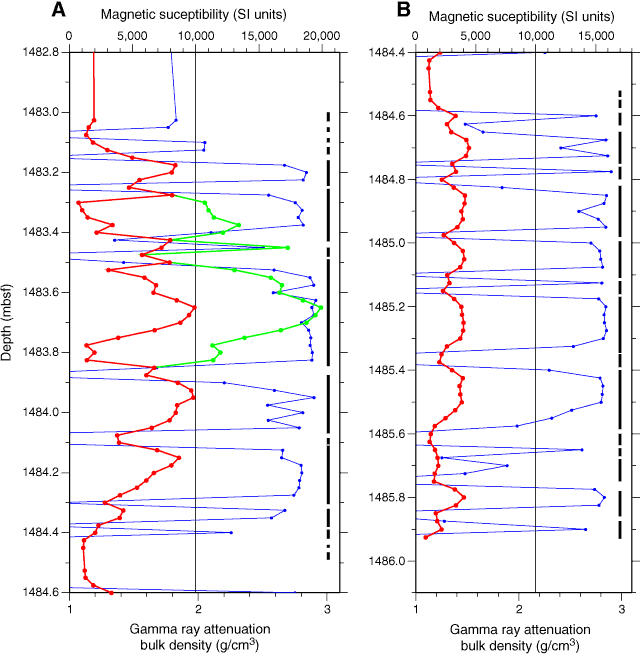
Figure F337. The highest values of magnetic susceptibility in Hole 1256D occur in a 1.3 m thick interval in (A) Section 312-1256D-230R-1 before decreasing to levels typical of gabbros in (B) Section 312-1256D-230R-2. Red line = magnetic susceptibility reported by the Bartington Instruments MS2C loop, green line = corrected values after addition of 10,000 (see “Physical properties” in the “Methods” chapter). Corrections were confirmed by running the archive half of the core through the MST. Black vertical line = depth location of rock pieces in cores. Blue line = GRA bulk density peaks in pieces of rock core exceeding 5 cm.

Previous | Close | Next | Top of page