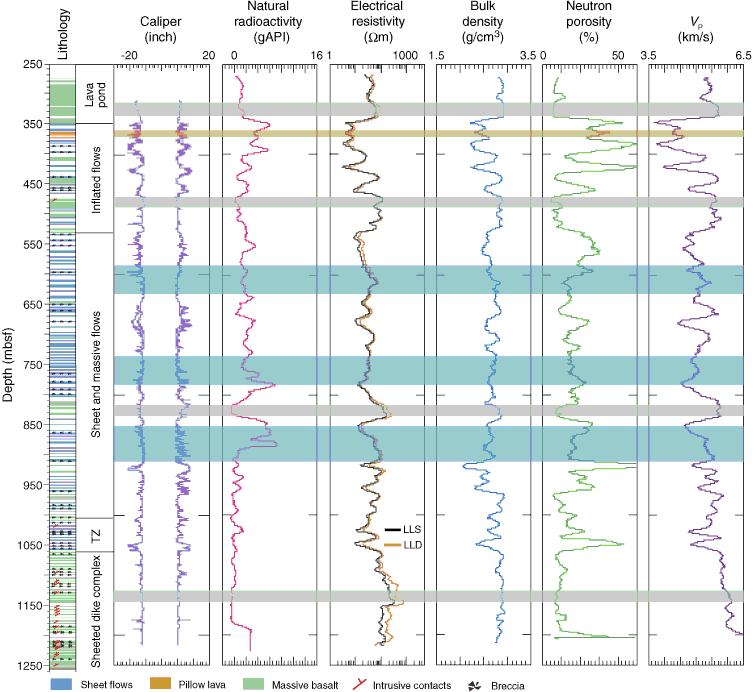
Figure F340. Caliper, total gamma ray emission, electrical resistivity, bulk density, neutron porosity, and compressional velocity data in Hole 1256D acquired during Leg 206 and Expedition 309. Individual well-logging data points were averaged to 10 m running averages to determine the principal relations and possible trends between wireline logs and core lithology. Note the stark contrast in velocity and resistivity between the massive units and pillow basalts, brecciated, and fractured units. Also observed is the decoupling of shallow (LLS) and deep (LLD) resistivity below 1080 mbsf. Relative differences in log response between structurally different rock types is highlighted in eight different sections of Hole 1256D. TZ = transition zone.

Previous | Close | Next | Top of page