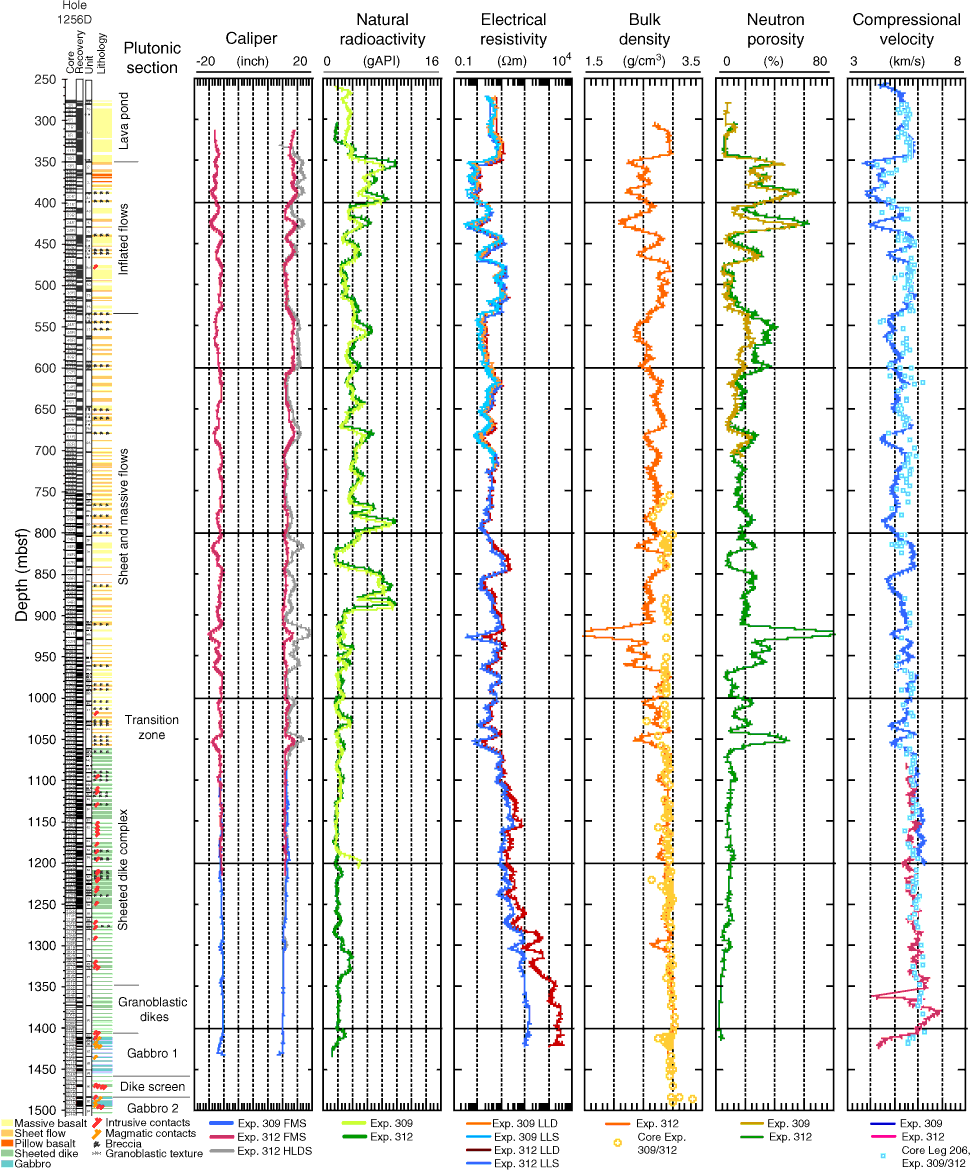
Figure F342. Caliper, total gamma ray, electrical resistivity, bulk density, neutron porosity, and compressional velocity acquired during Expedition 309/312. Circles represent bulk density and averaged compressional velocities (x, y, and z components) measured on discrete sample cubes from Leg 206 and Expedition 309/312. Velocities of Expedition 312 samples were shifted 0.42 km/s higher to be consistent with results of interexpedition calibration.

Previous | Close | Next | Top of page