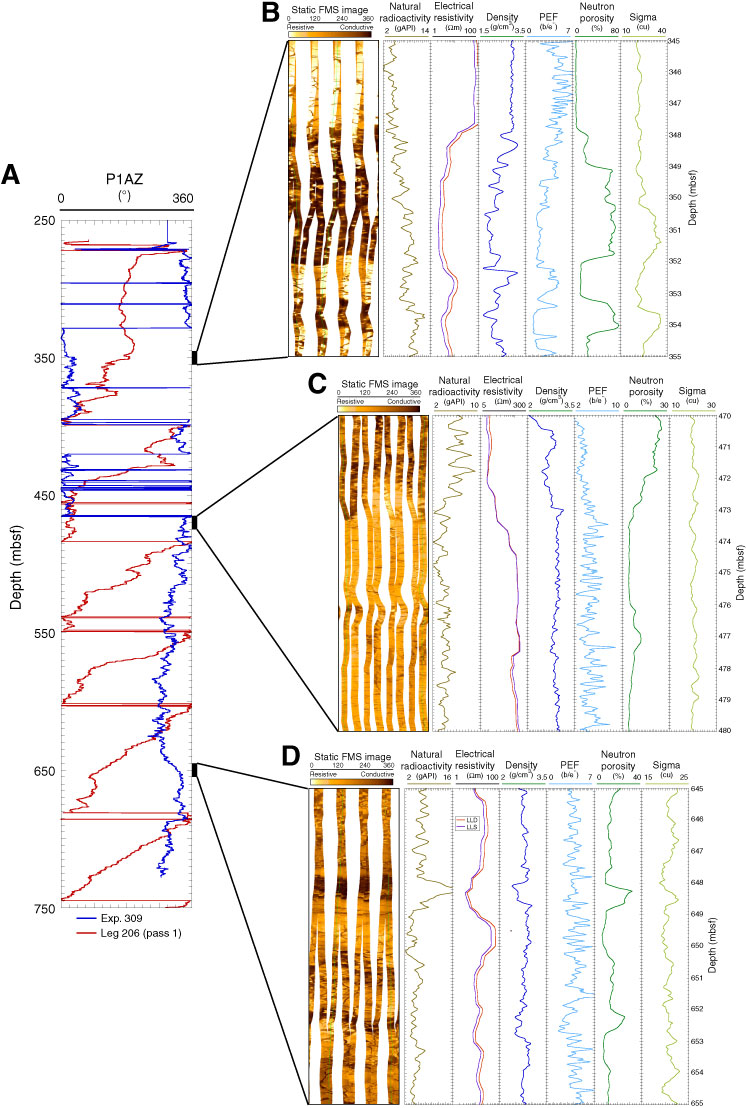
Figure F43. A. Rotation history of the FMS-sonic tool string recorded during Leg 206 (pass 1) and Expedition 309. B–D. FMS images of depth intervals 345–355, 470–480, and 645–655 mbsf. Expedition 309 and Leg 206 (pass 1) FMS images (static normalization) are reported. Pad 1 Azimuth (P1AZ) is the green curve on the FMS images. LLD = deep laterolog, LLS = shallow laterolog, PEF = photoelectric effect. (B) Transition between the lava pond (Unit 1) and thin flows (Unit 2) at 348 mbsf. This transition is characterized by a strong decrease in the electrical resistivity. (C) Transition between a thin flow unit and a massive unit at 473 mbsf. (D) Massive unit displaying a marked increase of natural radioactivity at 648 mbsf. This interval can be correlated with the low-temperature alteration zone described in Core 206-1256D-57R.
Previous | Close | Next | Top of page