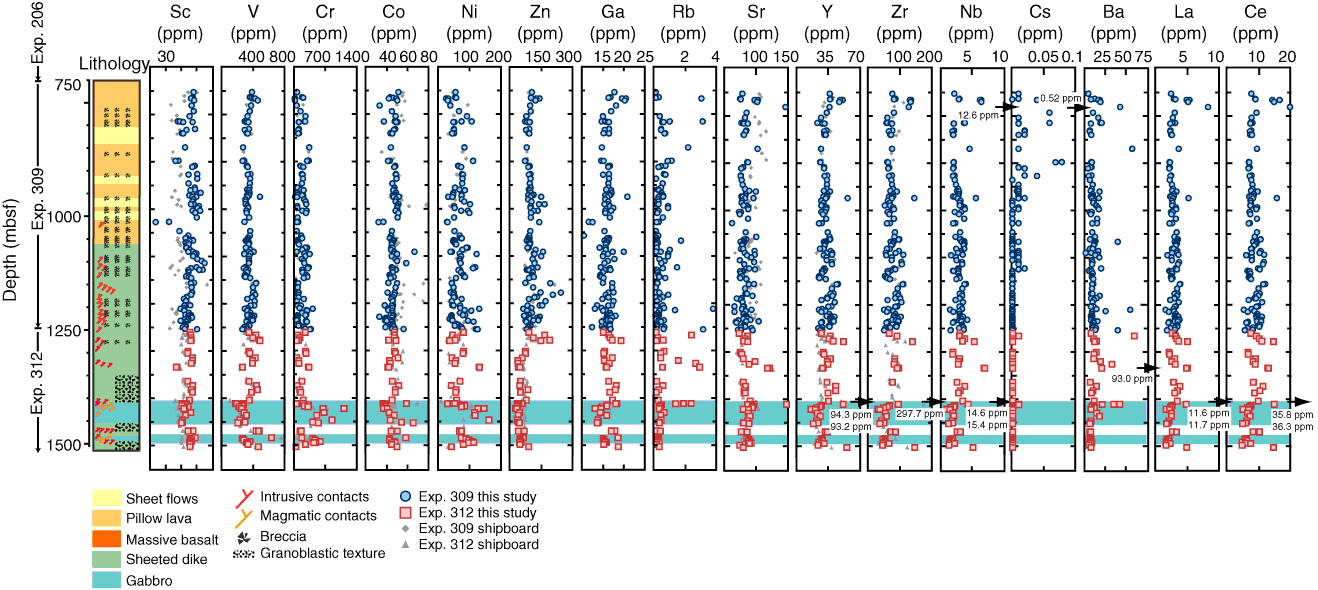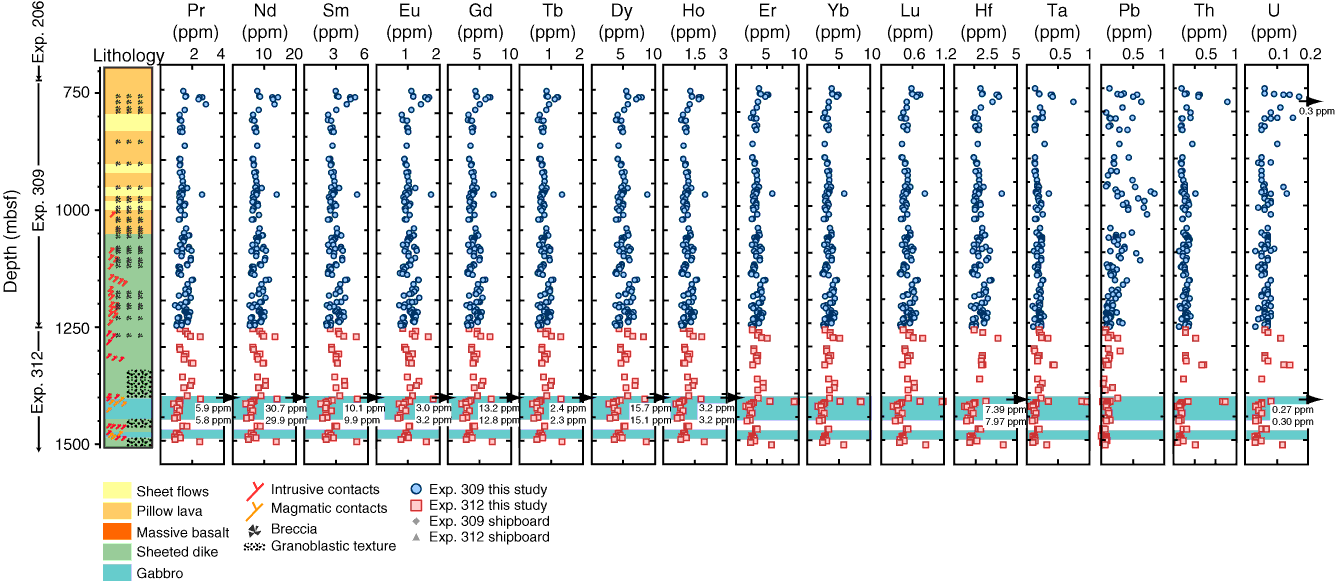
Figure F7. Downhole variation diagram of trace element abundances of the pool samples by inductively coupled plasma–mass spectrometry analyses of this study. Shipboard analyses data of Co, Zn, Sc, Cr, V, Zr, Y, Sr, Ba, and Ni abundances by inductively coupled plasma–atomic emission spectroscopy from Expedition 309/312 are also plotted. Blue bands = gabbro intervals.


Previous | Close | Next | Top of page