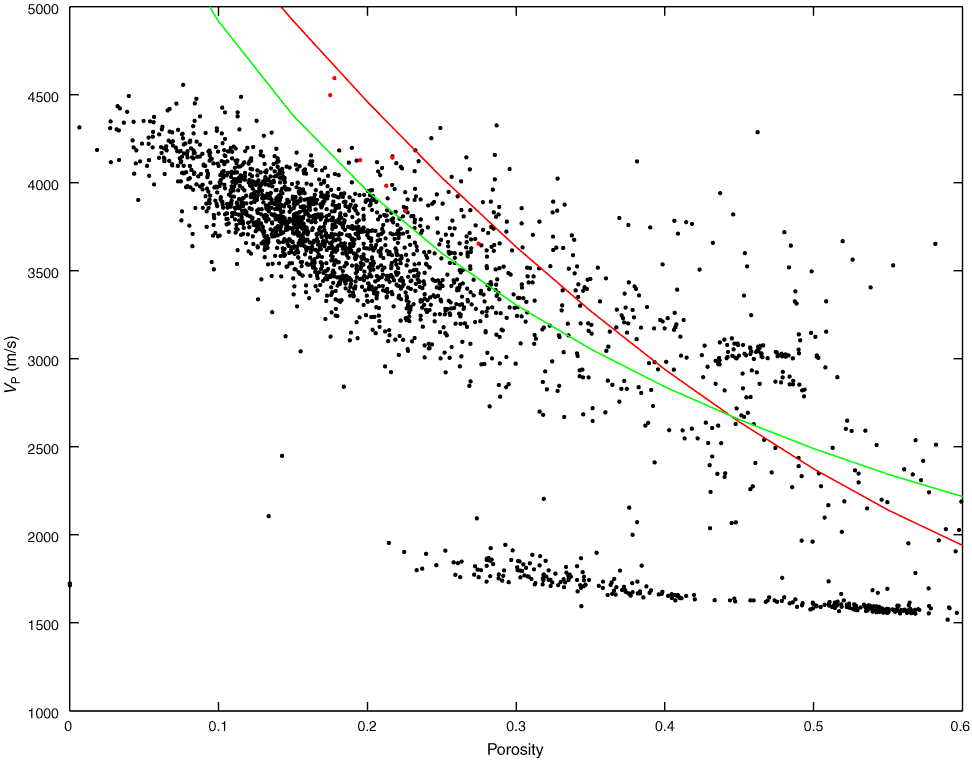
Figure F70. Cross plot of porosity with velocity for Hole M0005D. Solid lines = Wyllie time average equation (red; Wylie et al., 1956) and Raymer modified time average equation (green; Raymer et al., 1980) for a matrix velocity of calcite (6530 m/s). Discrete measurements are superimposed (red circles).

Previous | Close | Next | Top of page