Previous | Close | Next
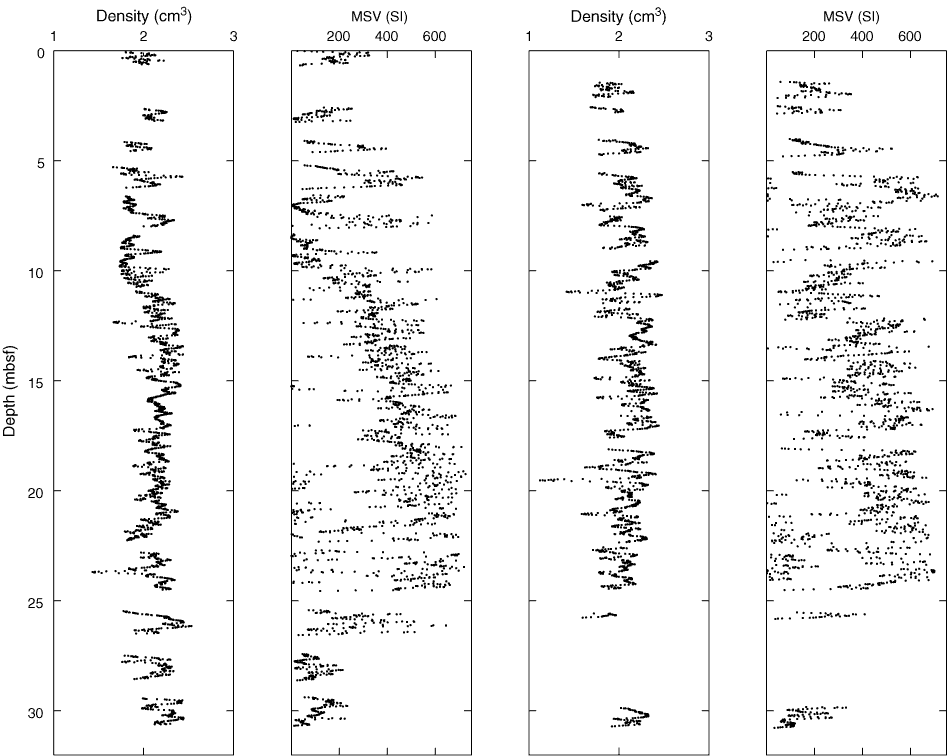
Figure F15. MSCL density and magnetic susceptibility correlation diagram as a function of depth for Site M0023.
Previous | Close | Next | Top of page