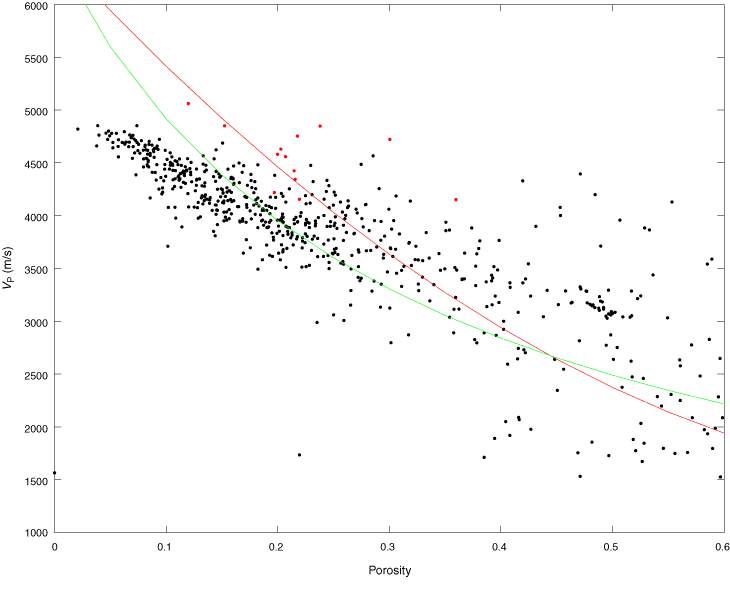
Figure F68. Cross plot of porosity with velocity for M0009, M0021, and M0024–M0026. Solid lines refer to the Wyllie time average equation (red) and Raymer modified time average equation (green) for a matrix velocity of calcite (6530 m/s). Discrete measurements are superimposed (red circles).

Previous | Close | Next | Top of page