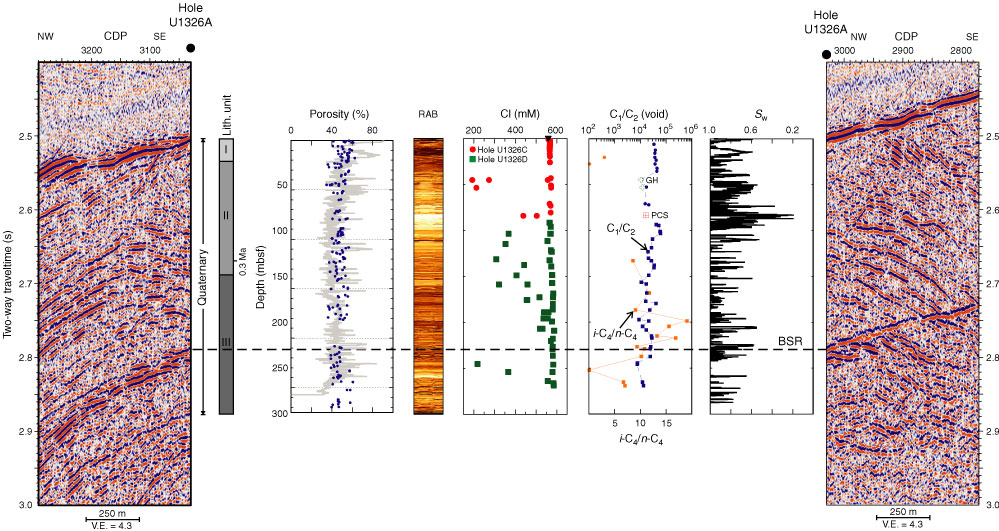
Figure F13. Comparison of seismic data from MCS Line PGC9902_CAS03_MCS and key data from Site U1326, including lithostratigraphic units (Holes U1326C and U1326D), porosity from LWD/MWD data (Hole U1326A) and MAD data (Holes U1326C and U1326D), resistivity-at-the-bit (RAB) data from LWD/MWD (Hole U1326A), interstitial water chlorinity (Holes U1326C and U1326D), C1/C2 ratio (Holes U1326C and U1326D), and pore water saturation (Sw) from LWD data (Hole U1326A). The bright band of high electrical reflectivity as seen in the RAB image (identified in Hole U1326A) does not correlate to a prominent seismic event. Solid triangle = seawater Cl, CDP = common depth point, GH = gas hydrate, PCS = pressure core sampler, BSR = bottom-simulating reflector, V.E. = vertical exaggeration.
Previous | Close | Next | Top of page